

Figma stock is under heavy pressure after surrendering nearly all its post-IPO gains, closing Thursday at $16.82. The daily chart paints a clear bearish picture. Intraday structure offers no challenge to that verdict. Until price reclaims meaningful levels, the path of least resistance remains lower.
Summary
Key takeaways
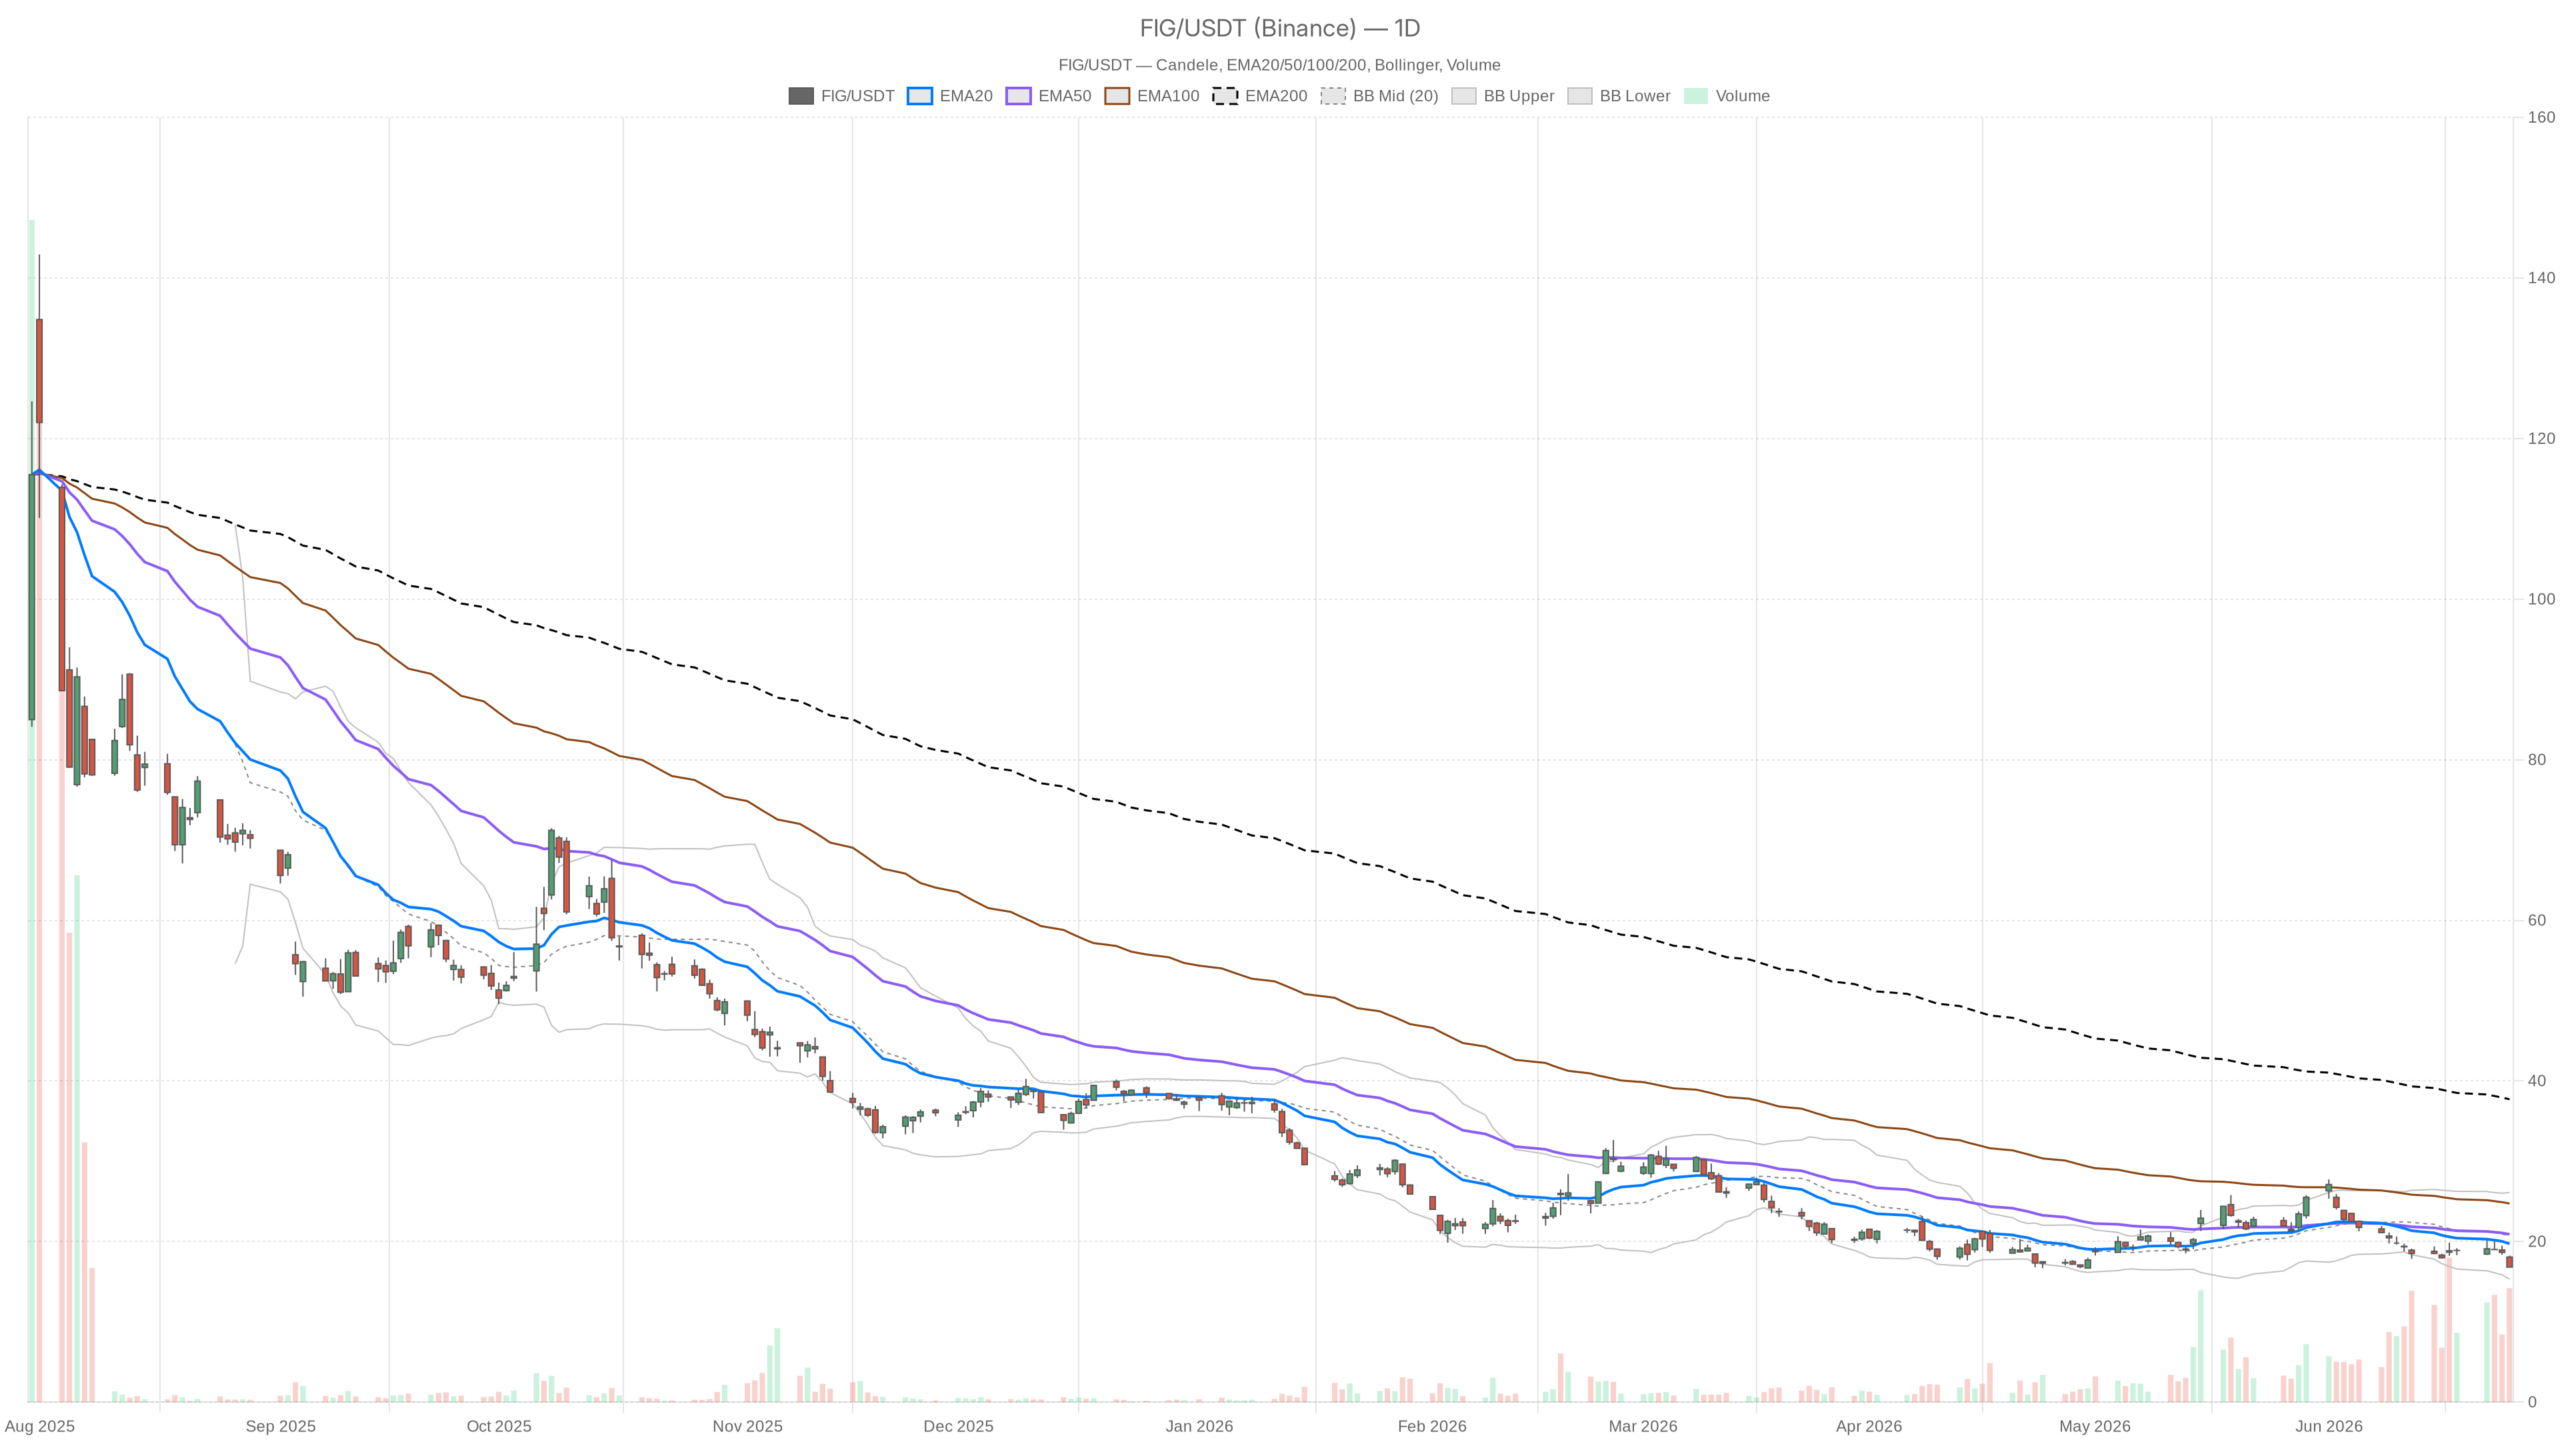
- FIG closed Thursday at $16.82, well below the 20-day EMA at $19.72 and the 50-day EMA at $20.90.
- Daily RSI sits at 34.26, approaching but not yet breaching the oversold 30 threshold.
- MACD continues to diverge negatively on both daily and hourly timeframes, with no sign of momentum exhaustion.
- A break below $16.33 support opens the door to the lower Bollinger Band at $15.33 as the next reference.
- The bullish case requires reclaiming $17.77, then a sustained hold above the $19.72 EMA20 on meaningful volume.
Daily Timeframe: Trend Remains Decisively Bearish
The daily trend for Figma stock is unambiguously bearish. Price trades below all three major EMAs, and momentum indicators show no signs of exhaustion. FIG closed June 25 at $16.82, well below the 20-day EMA at $19.72 and the 50-day EMA at $20.90. The EMA200 sits at $37.72 — a distant reminder of where the stock traded not long ago. That stacked EMA structure confirms sustained distribution rather than a temporary pullback.
Momentum Indicators Confirm Distribution
The daily RSI at 34.26 is edging toward oversold territory but has not yet crossed the critical 30 threshold. That matters. Oversold readings alone do not reverse trends. At current momentum, RSI could spend weeks grinding near this level without triggering a meaningful bounce.
Meanwhile, the daily MACD tells a similar story. The MACD line sits at -0.95 against a signal of -0.62, with a histogram of -0.34. The spread is widening, not contracting. There is no sign of momentum exhaustion here — the bearish impulse remains active.
Bollinger Bands on the daily chart add important context. The mid-band stands at $20.71, and the lower band is at $15.33. Price is trading in the lower half of the channel, pointing to continued pressure. However, the wide band spread — upper at $26.10 versus lower at $15.33 — reflects elevated volatility. A whipsaw cannot be ruled out.
The daily ATR of 1.23 confirms that FIG remains a volatile name. In a single session, the stock can absorb a move of over $1.20 in either direction. Thursday’s session illustrated this clearly. FIG opened at $18.07, hit a high of $18.25, then plunged to close at $16.82. A $1.43 intraday range signals serious selling pressure.
Daily pivot levels place the pivot point at $17.29, with resistance at $17.77 and support at $16.33. Price closed below the pivot, reinforcing the short-term bearish bias within the session structure.
Hourly Timeframe: No Relief for Bulls
The hourly chart reinforces the bearish outlook for Figma stock, with every indicator confirming continued downside pressure. The 1-hour RSI has dropped to 28.16 — technically oversold. In a different context, that might encourage contrarian thinking. Here, it deepens the concern. The hourly EMA structure mirrors the daily. Price trades below the 20 EMA at $18.04, the 50 EMA at $18.67, and the 200 EMA at $19.98. All three remain in a bearish cascade.
The hourly MACD line at -0.56 versus a signal of -0.36 continues to diverge negatively. The histogram at -0.20 shows no sign of flipping. Therefore, even on an intraday basis, there is no technical evidence of a reversal attempt forming.
Hourly Bollinger Bands narrow the picture further. The lower band sits at $16.39, with FIG trading at $16.82 — just above that boundary. Price is hugging the lower band. In strong downtrends, this can persist for extended periods without any meaningful recovery. The hourly pivot at $16.87 sits just above current price, acting as immediate resistance.
15-Minute Timeframe: Noise Within the Trend
The 15-minute timeframe offers no reversal signal for Figma stock — only micro-level noise within a dominant downtrend. On the 15-minute chart, the regime remains bearish across all EMAs. Price closed at $16.82, sitting just below the lower Bollinger Band of $16.85. Notably, the 15-minute MACD histogram turned marginally positive at +0.03. This is a micro-level signal and should not be overread. It is not a reversal signal.
The 15-minute ATR of just $0.11 indicates that intraday volatility has compressed as the session wound down. That compression, combined with price near the lower band, could produce a minor bounce at the open. However, any such move should be treated as a potential relief rally within a dominant downtrend.
The Bullish Case: What Must Happen for a Reversal
For Figma stock’s bullish case to become technically credible, price must first reclaim $17.77, then push above the $19.72 EMA20 on meaningful volume. Some market participants are looking past the technical damage. A Yahoo Finance analysis published June 25 carries a price target of $36.78 for FIG — more than double current levels. That thesis rests on the premise that the selloff has been excessive relative to the company’s fundamentals and AI-driven growth prospects. Figma’s Config 2026 event and the debut of its AI-powered assistant represent genuine product catalysts.
Technical Thresholds for Trend Rehabilitation
An analyst also maintained a bullish stance on June 24 following executive discussions. However, for a credible reversal to develop technically, FIG would need to clear several hurdles. First, price must reclaim the $17.77 daily R1 pivot on meaningful volume. Next, it must push above the $18.07–$18.25 zone where Thursday’s session opened and failed.
A sustained hold above the daily EMA20 at $19.72 represents the real line in the sand for any trend rehabilitation. On the AI tailwind narrative, sentiment could shift faster than price structure suggests. However, that depends on Figma demonstrating monetization of its AI toolkit, particularly prompt-to-design generation.
The Bearish Scenario: Why the Downtrend Holds
The bearish case for Figma stock needs little additional confirmation. Price already sits below every major moving average, and MACD continues to diverge negatively on both daily and hourly timeframes. A break below daily support at $16.33 would open the door to the lower Bollinger Band at $15.33. That level is the next meaningful technical reference. Below it, there is very limited structure to anchor any recovery attempt.
Sentiment Divergence Adds Selling Pressure
Meanwhile, the news flow reflects a divided market. While analysts are selectively bullish, retail sentiment is reportedly bearish. A June 24 headline flagged retail remaining on the sell side even as the stock attempted a bounce. That kind of divergence between institutional optimism and retail positioning can prolong selling pressure.
Positioning and Volatility: Conflicting Signals
Overall, Figma stock’s technical setup and fundamental narrative are pulling in opposite directions. The daily ATR remains above $1.20, keeping volatility elevated. The daily and hourly charts are aligned bearishly, with no cross-timeframe conflict on direction — only on magnitude and timing. The 15-minute chart offers no meaningful reversal signal, just a brief pause in momentum.
Traders should treat any near-term bounce as a potential re-entry opportunity for short positioning — unless price reclaims $17.77 and holds. Longer-term investors watching the AI story will need patience. Ideally, a technical break back above $19.72 is needed before the fundamental thesis has a credible price structure to stand on.
FAQ
Is Figma stock oversold and due for a bounce?
The hourly RSI at 28.16 is technically oversold. However, in strong downtrends, oversold readings alone do not trigger reversals. Price can remain near oversold levels for extended periods without a meaningful bounce.
What is the key support level for FIG?
The immediate support sits at $16.33, the daily S1 pivot. A break below that level would open the door to the lower Bollinger Band at $15.33, which represents the next meaningful technical reference.
What needs to happen for Figma stock to turn bullish?
FIG must reclaim $17.77, the daily R1 pivot, on meaningful volume. It then needs to push above the $18.07–$18.25 session zone. The critical threshold for trend rehabilitation is a sustained hold above the 20-day EMA at $19.72.
Disclaimer: This article is for informational purposes only and does not constitute financial advice, an investment recommendation, or a solicitation to buy or sell any financial instrument or cryptocurrency. The analysis provided is not indicative of future results. Investing in crypto assets and financial markets carries a high risk of capital loss. Always do your own research (DYOR) and consult a qualified financial advisor before making any decision.
Article produced with the assistance of artificial intelligence and reviewed by the editorial team.