

The crypto market remains under pressure, and Solana price today tells a story of two conflicting narratives. At roughly $70.46 as of June 26, 2026, SOL sits wedged between an oversold daily chart and overheated short-term timeframes — a tension that punishes overconfidence on either side.
Summary
Key takeaways
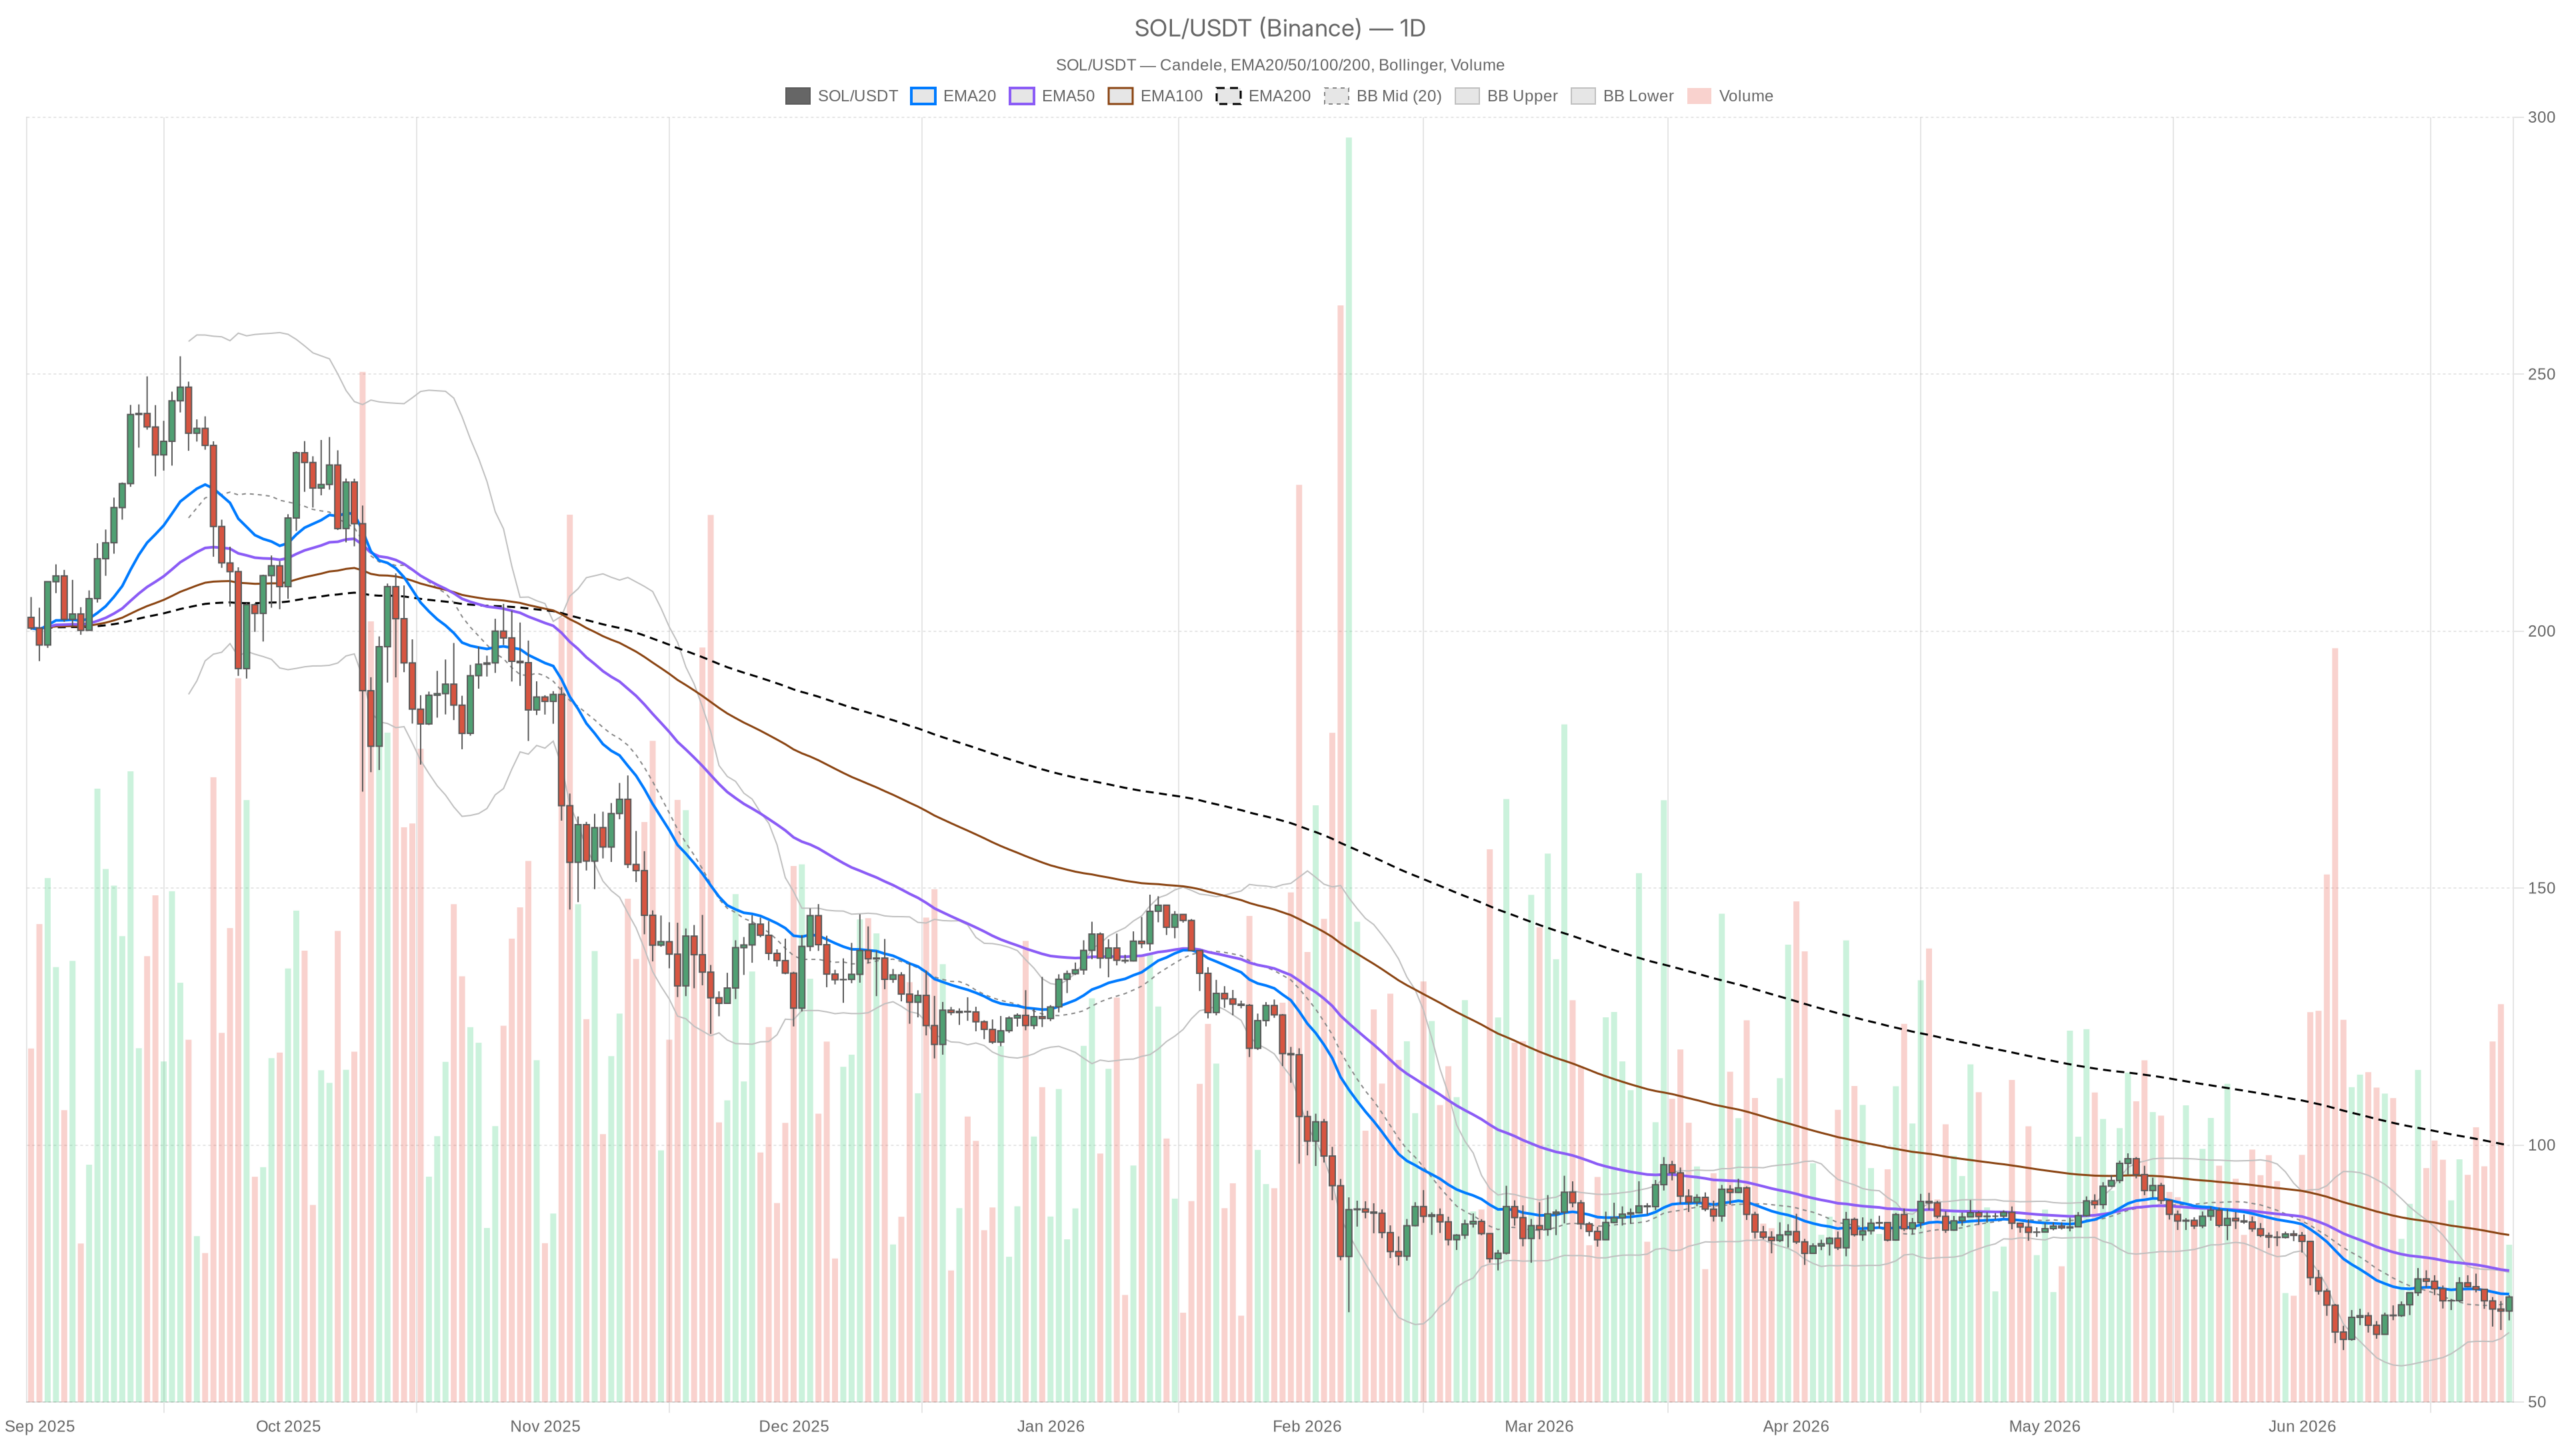
- Solana trades at $70.46, below all major daily moving averages including the 200-day EMA at $99.97
- Daily RSI at 46.35 confirms bearish structure, though the MACD histogram hints at slowing selling pressure
- 15-minute RSI at 74.28 signals overbought conditions on the shortest timeframe
- Fear & Greed Index at 13 (Extreme Fear) reflects broad defensive positioning across crypto markets
- A decisive daily close above $72.20 is required to challenge the dominant bearish thesis
The Daily Picture
The daily chart remains unambiguously bearish, with Solana trading below every meaningful moving average and deep in a structural downtrend. SOL closed at $70.46, sitting below both its 20-day EMA at $71.03 and its 50-day EMA at $75.59. More tellingly, it sits far below the 200-day EMA at $99.97. Price would need to rally nearly 42% just to reach that long-term equilibrium line. This is not a dip in a bull market — it is a sustained downtrend with occasional relief bounces.
The broader crypto market is not helping. Total market cap has slipped to approximately $2.14 trillion, down 2.6% in the past 24 hours, while Bitcoin dominance holds firm above 55.9%. That is capital staying defensive, parked in BTC while altcoins like SOL absorb the pressure. Until dominance starts rotating lower, Solana’s recovery attempts are likely to remain fragile.
The daily RSI at 46.35 sits below the 50 midline, confirming the bearish lean, but is not yet oversold enough to signal a reversal. There is room to fall further without RSI becoming a meaningful support argument. The MACD line at -1.76 remains negative and below its signal line at -2.22. However, the histogram has ticked positive at +0.46, suggesting selling pressure is losing velocity — not that buyers have taken control.
Bollinger Bands on the daily place the midline at $69.40, the upper band at $75.25, and the lower band at $63.55. Price is hovering just above the midline, which in a downtrend typically acts as resistance rather than support. Moreover, the upper band at $75.25 lines up almost exactly with the 50-day EMA, forming a formidable resistance cluster. The Average True Range of $4.11 means any daily candle can swing more than $4 — significant volatility relative to the current price level.
Daily pivot levels place the pivot point at $69.06, with R1 at $72.20 and S1 at $67.31. Price is trading above the pivot — marginally constructive intraday — but R1 at $72.20 is the first real test. Failing there would clearly signal that the daily bearish structure is reasserting itself.
Hourly Momentum
The 1-hour chart paints a starkly different picture, with short-term momentum squarely in the bulls’ corner. Price at $70.49 is trading above all three EMAs — the 20-hour at $67.96, the 50-hour at $68.18, and even the 200-hour at $69.90. That is a clean bullish stack on the hourly timeframe. The 1H RSI at 64.36 is elevated but not yet overbought, leaving some room for continuation. Meanwhile, the MACD has produced a fresh bullish crossover, with the line at +0.38 above signal at -0.04 and a histogram reading of +0.42.
That said, the 1-hour Bollinger Bands tell a cautionary tale. Price at $70.49 has pushed above the upper band at $70.07, a classic sign of a band squeeze breakout. Strong momentum, but statistically prone to mean reversion back toward the midline at $67.28. The hourly regime is tagged as neutral — momentum runs in one direction, but the macro context keeps a ceiling on conviction.
15-Minute Overheating
The 15-minute chart is technically overbought, with RSI at 74.28 and price straining against the upper Bollinger Band. All three short-term EMAs are stacked bullishly — the 200 EMA at $68.07, the 50 at $67.93, and the 20 at $68.68. The MACD histogram at +0.26 remains positive but is decelerating relative to the line-versus-signal spread. This setup can work for momentum scalpers catching the last leg of a move. However, entering fresh longs based on 15-minute signals alone carries high risk. The 15-minute chart is useful for timing entries, not for justifying them.
DeFi Ecosystem Signals
On-chain activity across Solana’s DeFi ecosystem is mixed, with some protocols growing while the largest cools off. According to DefiLlama data, Raydium AMM saw fees drop 45.78% in the past day and 17.28% over the week — a meaningful pullback in trading volume that aligns with the bearish price action. Nevertheless, Orca DEX and Meteora DLMM tell a different story. Orca is up 66.8% over 30 days and 30.55% over 7 days in fee generation. BisonFi has surged an extraordinary 123.67% over 30 days.
This suggests that while Raydium’s activity is cooling, other parts of Solana’s DEX ecosystem are actually growing. It does not change the price structure, but it is a data point that prevents writing off the ecosystem entirely. For those tracking Solana price today, these mixed on-chain signals add useful context to the technical picture.
Two Scenarios Worth Preparing For
Two scenarios dominate the outlook: a bullish breakout above $72.20 or a bearish slide toward $63.55. The bullish case requires SOL to hold above the hourly 200 EMA near $69.90 on any pullback and push through the $72.20 resistance cluster with conviction. If that happens, the next target is the daily upper Bollinger Band at $75.25, which coincides with the 50-day EMA. A daily close above that level would be the first genuine sign of a trend attempting to turn. What invalidates this? A clean break back below $69.90 on the hourly, meaning the recent push was just another failed bounce.
Conversely, the bearish case is structurally dominant right now. Price sits below the daily 20 EMA, deep below the 50 and 200, with RSI unable to reclaim 50 on the daily and the broader market in Extreme Fear. If the $69.06 daily pivot gives way and price undercuts $67.31 (S1), the next logical zone is the lower Bollinger Band at $63.55 — a roughly 10% decline from current levels. The ATR suggests this could unfold over just a few volatile daily candles. A decisive daily close above $72.20 would start poking holes in this thesis.
Positioning in This Environment
The honest read is that intraday momentum is real but rests on a structurally broken daily chart, demanding patience above conviction. Anyone trading the short-term move higher must keep the macro context close. The daily chart is not confirming, and the Fear & Greed reading of 13 signals that market participants broadly are not in a risk-taking mood. Volatility remains high with a daily ATR above $4, meaning both directions carry meaningful range. The $70 level has become a psychological pivot — trading above it is necessary but not sufficient for bulls. Sustained trading below it ends the relief rally conversation fast.
FAQ
Is Solana in a bear market?
Yes. SOL trades well below its 200-day EMA at $99.97 and would need a 42% rally just to reclaim that level. The daily RSI at 46.35 confirms bearish momentum, and the Fear & Greed Index at 13 reflects extreme risk aversion across the market.
What level must Solana break to turn bullish?
A decisive daily close above $72.20 — the R1 pivot level — would be the first meaningful challenge to the bearish thesis. Above that, $75.25 aligns with the 50-day EMA and the daily upper Bollinger Band, forming the next resistance cluster.
What is the key support level for Solana right now?
The immediate support sits at $69.06 (daily pivot), followed by $67.31 (S1). Below those, the lower Bollinger Band at $63.55 represents the next significant demand zone — roughly 10% below current levels.
Why is Solana’s short-term momentum positive despite the bearish daily chart?
The 1-hour chart shows price above all three EMAs with a fresh MACD bullish crossover, reflecting genuine short-term buying interest. However, the 15-minute RSI at 74.28 warns that this momentum may be nearing exhaustion, making new long entries risky at current levels.
Disclaimer: This article is for informational purposes only and does not constitute financial advice, an investment recommendation, or a solicitation to buy or sell any financial instrument or cryptocurrency. The analysis provided is not indicative of future results. Investing in crypto assets and financial markets carries a high risk of capital loss. Always do your own research (DYOR) and consult a qualified financial advisor before making any decision.
Article produced with the assistance of artificial intelligence and reviewed by the editorial team.