

As of June 30, 2026, the bitcoin price today sits at $59,324, with selling pressure dominating every meaningful timeframe. The Crypto Fear & Greed Index reads 15 — Extreme Fear. This is not a dip being bought but a market being abandoned, at least for now.
Summary
Key takeaways
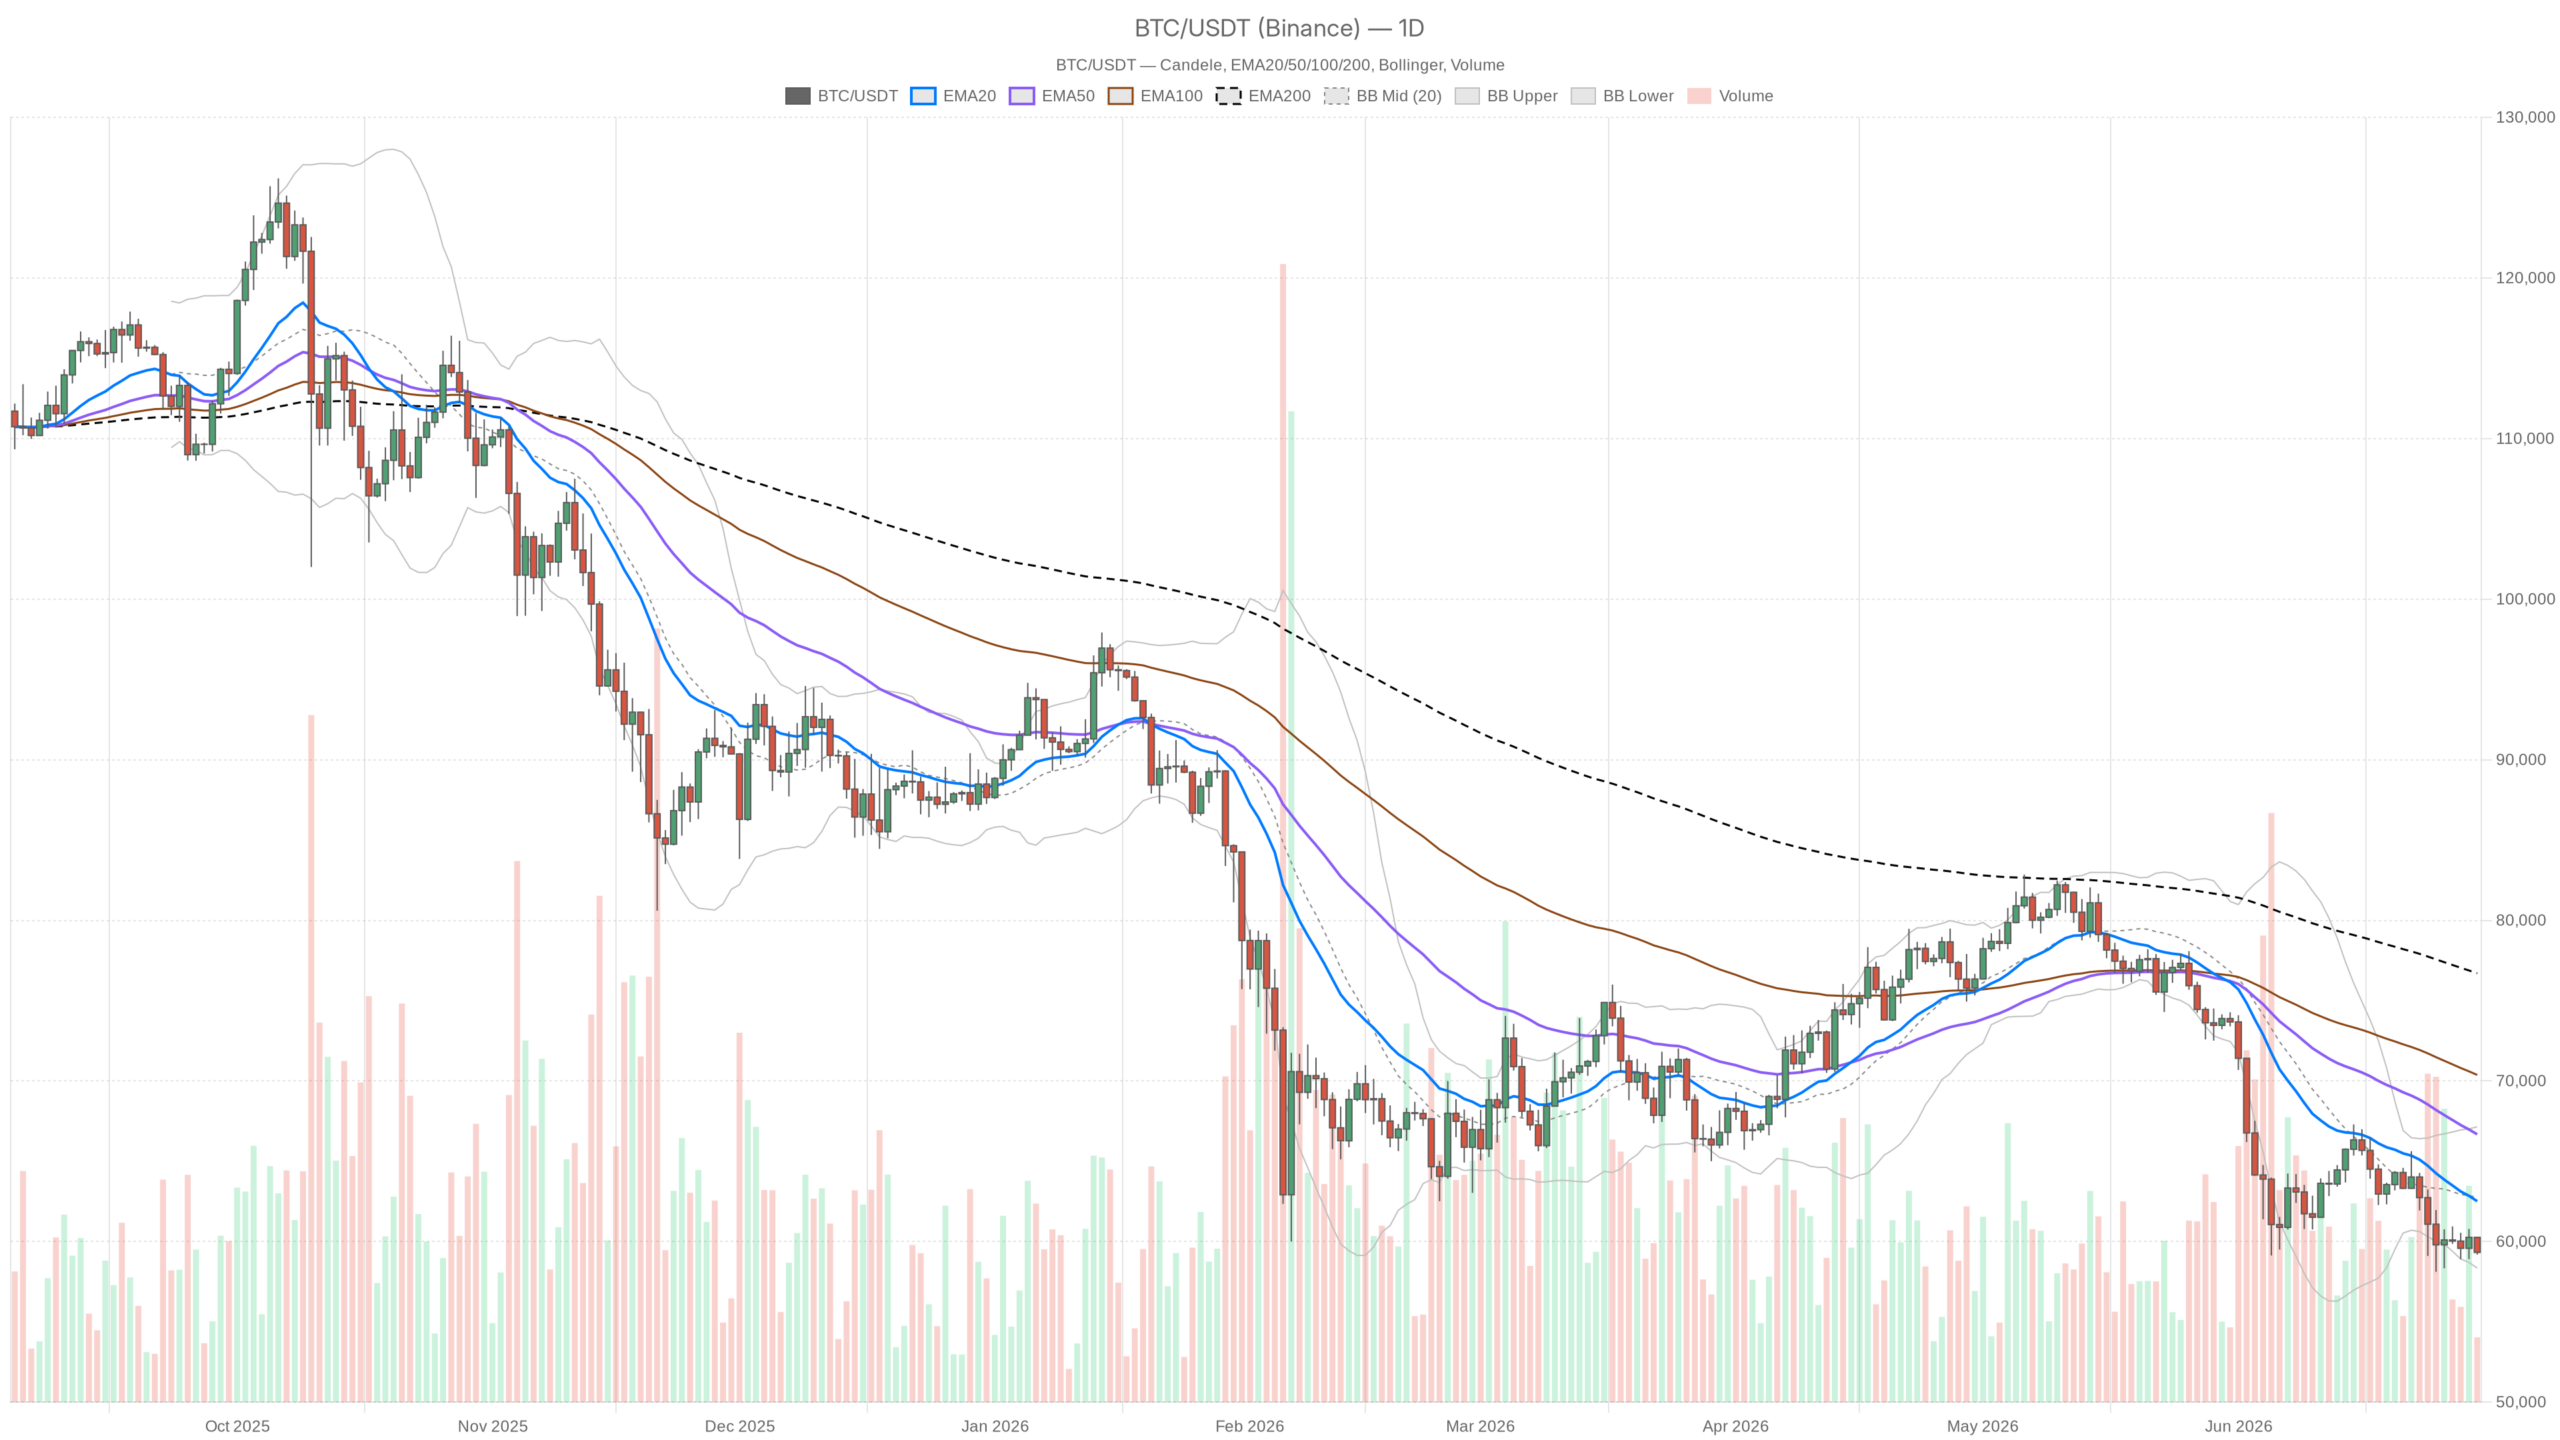
- Bitcoin trades at $59,324, well below the EMA20 ($62,509), EMA50 ($66,677), and EMA200 ($76,703).
- Strategy is reportedly preparing to sell up to $1.25 billion in Bitcoin, adding institutional supply pressure to an already fragile market.
- The Crypto Fear & Greed Index sits at 15 (Extreme Fear), marking a sentiment extreme with no confirmed capitulation yet.
- Daily RSI at 31.9 flirts with oversold territory but has not produced a confirmed reversal signal.
- The $58,347–$58,916 zone is the critical support area; a daily close below it opens a path toward $55,000–$56,000.
Daily Chart Breakdown: The Dominant Trend Is Bearish
Bitcoin’s daily chart structure is unambiguously broken. Price sits below every major moving average, and no reversal signal has materialized despite the RSI hovering near oversold territory.
On the daily timeframe, Bitcoin closed at $59,324, below the EMA20 at $62,509, the EMA50 at $66,677, and the EMA200 at $76,703. This is a full bear stack — every dynamic average sits above price and acts as resistance rather than support. The EMA200 at $76,703 serves as a stark reminder of how far this market has traveled from its highs.
The daily RSI reads 31.9, hovering just above the oversold threshold. However, that proximity does not signal a bottom. In extended downtrends, RSI can grind along the 30 level for weeks without producing any meaningful bounce. What it does confirm is persistent and exhausting selling pressure. Tired sellers and hungry buyers are two very different things.
The MACD tells a story of acceleration that is barely slowing. The MACD line sits at -2,306 against a signal of -2,305, with a histogram reading of just -0.87. That near-zero histogram after deep negative divergence represents a flattening of bearish momentum — not a reversal, but a stall. Whether this pause becomes consolidation or a relief bounce depends entirely on price action around the $58,347 Bollinger Band lower boundary.
The daily Bollinger Bands place the midline at $62,747 and the lower band at $58,348. Price is pressing toward that lower band from the inside, signaling active volatility expansion. Moreover, the ATR of $2,120 confirms that daily swings of that magnitude are well within normal range. A close below $58,347 would mark significant technical deterioration.
The daily pivot structure places the pivot point at $59,597, with R1 at $60,004 and S1 at $58,916. Price is below the pivot — a bearish configuration. S1 at $58,916 now serves as the first structural defense before the Bollinger lower band comes into play.
Short-Term Timeframes Confirm the Pressure
The hourly and 15-minute charts offer no relief from the bearish pressure. Every indicator on these timeframes aligns with the daily trend, reinforcing the downtrend rather than hinting at a reversal.
On the 1-hour chart, price at $59,324 sits below the EMA20 ($59,765), EMA50 ($59,905), and EMA200 ($60,923) — another full bear stack on a compressed timeframe. The hourly RSI at 37.89 is weak but not collapsed, suggesting the downside move is mature without having found a convincing base. That said, the 1H MACD histogram at -86.26 is notably aggressive for this scale, pointing to accelerating intraday bearish pressure.
This sharp hourly MACD divergence often precedes short-covering spikes. However, such spikes tend to be violent and short-lived in the current macro backdrop. Traders should not mistake them for trend reversals.
The 15-minute chart functions as an execution map rather than a decision-making tool. Price remains below all three EMAs — the 20 at $59,497, the 50 at $59,709, and the 200 at $59,932. The RSI reads 37.02, and the MACD histogram is slightly negative at -3.24. The 15m Bollinger Bands show price near the lower band at $59,253. Consequently, any micro bounce will likely find resistance quickly at the midline near $59,483.
Market Sentiment and Dominance: What the Numbers Reveal
Market sentiment is at extreme fear levels, and Bitcoin’s rising dominance reflects defensive capital rotation rather than genuine strength. The institutional backdrop compounds this fragility.
The bitcoin price today reflects a market where BTC dominance stands at 55.53%, according to CoinGecko data. In isolation, that figure might seem like a sign of relative strength. However, with total crypto market cap down 0.72% in 24 hours and Bitcoin under structural pressure, high dominance simply means capital is leaving crypto broadly — and Bitcoin is the last asset to be sold. That is a defensive pattern, not a bullish one.
The Fear & Greed Index reading of 15 is the kind of number that historically marks capitulation zones. Nevertheless, capitulation requires a final flush — a high-volume sell-off that clears weak hands and resets the market. Until that event materializes with a clear reversal candle and volume confirmation, extreme fear remains a warning rather than a buy signal.
What makes this moment particularly sharp is the catalyst in the headlines. According to Bloomberg and Fortune, Strategy — the largest institutional Bitcoin holder globally — is reportedly preparing to sell up to $1.25 billion in Bitcoin. The company aims to restructure its financing model and address growing investor pressure around its preferred stock. For a market already under structural bearish weight, the prospect of institutional supply hitting order books keeps buyers firmly on the sidelines. The signal alone reshapes positioning, regardless of whether the sales have begun.
Bullish and Bearish Scenarios: Weighing the Probabilities
The bearish scenario currently carries more conviction, though a relief rally cannot be ruled out if the $58,347–$58,916 support zone holds. Both scenarios have clear invalidation points.
The bullish case hinges on Bitcoin holding the $58,347–$58,916 support zone and producing a daily close above the $59,597 pivot point. If that occurs alongside stabilization in the Strategy news cycle, a relief rally toward $62,500–$63,000 becomes plausible. That is not a trend reversal — it is a mean-reversion move toward the Bollinger midline and EMA20. However, the bullish case fails immediately if price closes a daily candle below $58,000 on expanding volume.
The bearish case is straightforward and currently carries more conviction. A daily close below $58,347 opens a measured move toward the $55,000–$56,000 zone. Moreover, the ATR suggests that range could be covered in just a few daily candles. The Strategy overhang is critical here.
If $1.25 billion in BTC supply becomes confirmed and structured selling begins, the market lacks sufficient bid depth at these prices. Absorbing that volume without a meaningful leg lower appears unlikely. The bearish scenario is invalidated only if price recaptures the EMA20 on the daily at $62,500 with conviction — a move requiring a sharp, catalyst-driven reversal.
Positioning Strategy: Why Patience Matters Now
Patience is the most valuable position in the current environment. With every timeframe signaling bearish pressure and volatility running high, aggressive entries carry disproportionate risk.
What this setup demands above all else is restraint. The daily regime is bearish, the 1H is bearish, and the 15m is bearish. The macro backdrop — institutional selling pressure and extreme fear sentiment — provides no structural reason for aggressive long positioning. That said, shorts are not a free lunch either. At RSI 31 on the daily with a flattening MACD histogram, the risk of a sharp, low-conviction short squeeze remains real.
The ATR of $2,120 daily means a trader must account for roughly $2,000 in normal price noise before a signal becomes meaningful. That is not a number to ignore in sizing decisions. Volatility is elevated, liquidity is fragile, and the next 48–72 hours around the $58,300–$59,600 zone will likely define Bitcoin’s path. Watch the daily close — that is where the real information lives.
FAQ
What is driving Bitcoin’s current price decline?
Bitcoin’s decline is driven by structural bearish pressure across all timeframes, compounded by reports that Strategy may sell up to $1.25 billion in Bitcoin. The Crypto Fear & Greed Index at 15 reflects extreme market anxiety, while price sits below all key moving averages.
What are the critical support levels to watch?
The key support zone lies between $58,347 (daily Bollinger lower band) and $58,916 (S1 pivot). A daily close below this zone would likely accelerate selling toward the $55,000–$56,000 range. The daily pivot at $59,597 serves as the first resistance level bulls need to reclaim.
Is the current RSI reading a buy signal?
No. While the daily RSI at 31.9 is near oversold territory, it has not produced a confirmed reversal. In extended downtrends, RSI can remain at these levels for weeks. A buy signal requires a clear reversal candle with volume confirmation, which has not yet materialized.
How does Strategy’s potential Bitcoin sale affect the market?
Strategy, the world’s largest institutional Bitcoin holder, is reportedly preparing to sell up to $1.25 billion in BTC. Even the prospect of such institutional supply hitting order books is enough to keep buyers sidelined. If confirmed, the market may lack sufficient bid depth to absorb the selling without a significant price decline.
The charts are telling a consistent story: Bitcoin is under structural bearish pressure across all timeframes. The Strategy news adds institutional weight to an already fragile market. While extreme fear and oversold RSI readings can precede reversals, no confirmation signal has emerged yet. The $58,347–$58,916 zone is the line in the sand — hold it, and a relief rally becomes possible; lose it, and $55,000–$56,000 comes into play quickly.
Disclaimer: This article is for informational purposes only and does not constitute financial advice, an investment recommendation, or a solicitation to buy or sell any financial instrument or cryptocurrency. The analysis provided is not indicative of future results. Investing in crypto assets and financial markets carries a high risk of capital loss. Always do your own research (DYOR) and consult a qualified financial advisor before making any decision.
Article produced with the assistance of artificial intelligence and reviewed by the editorial team.