

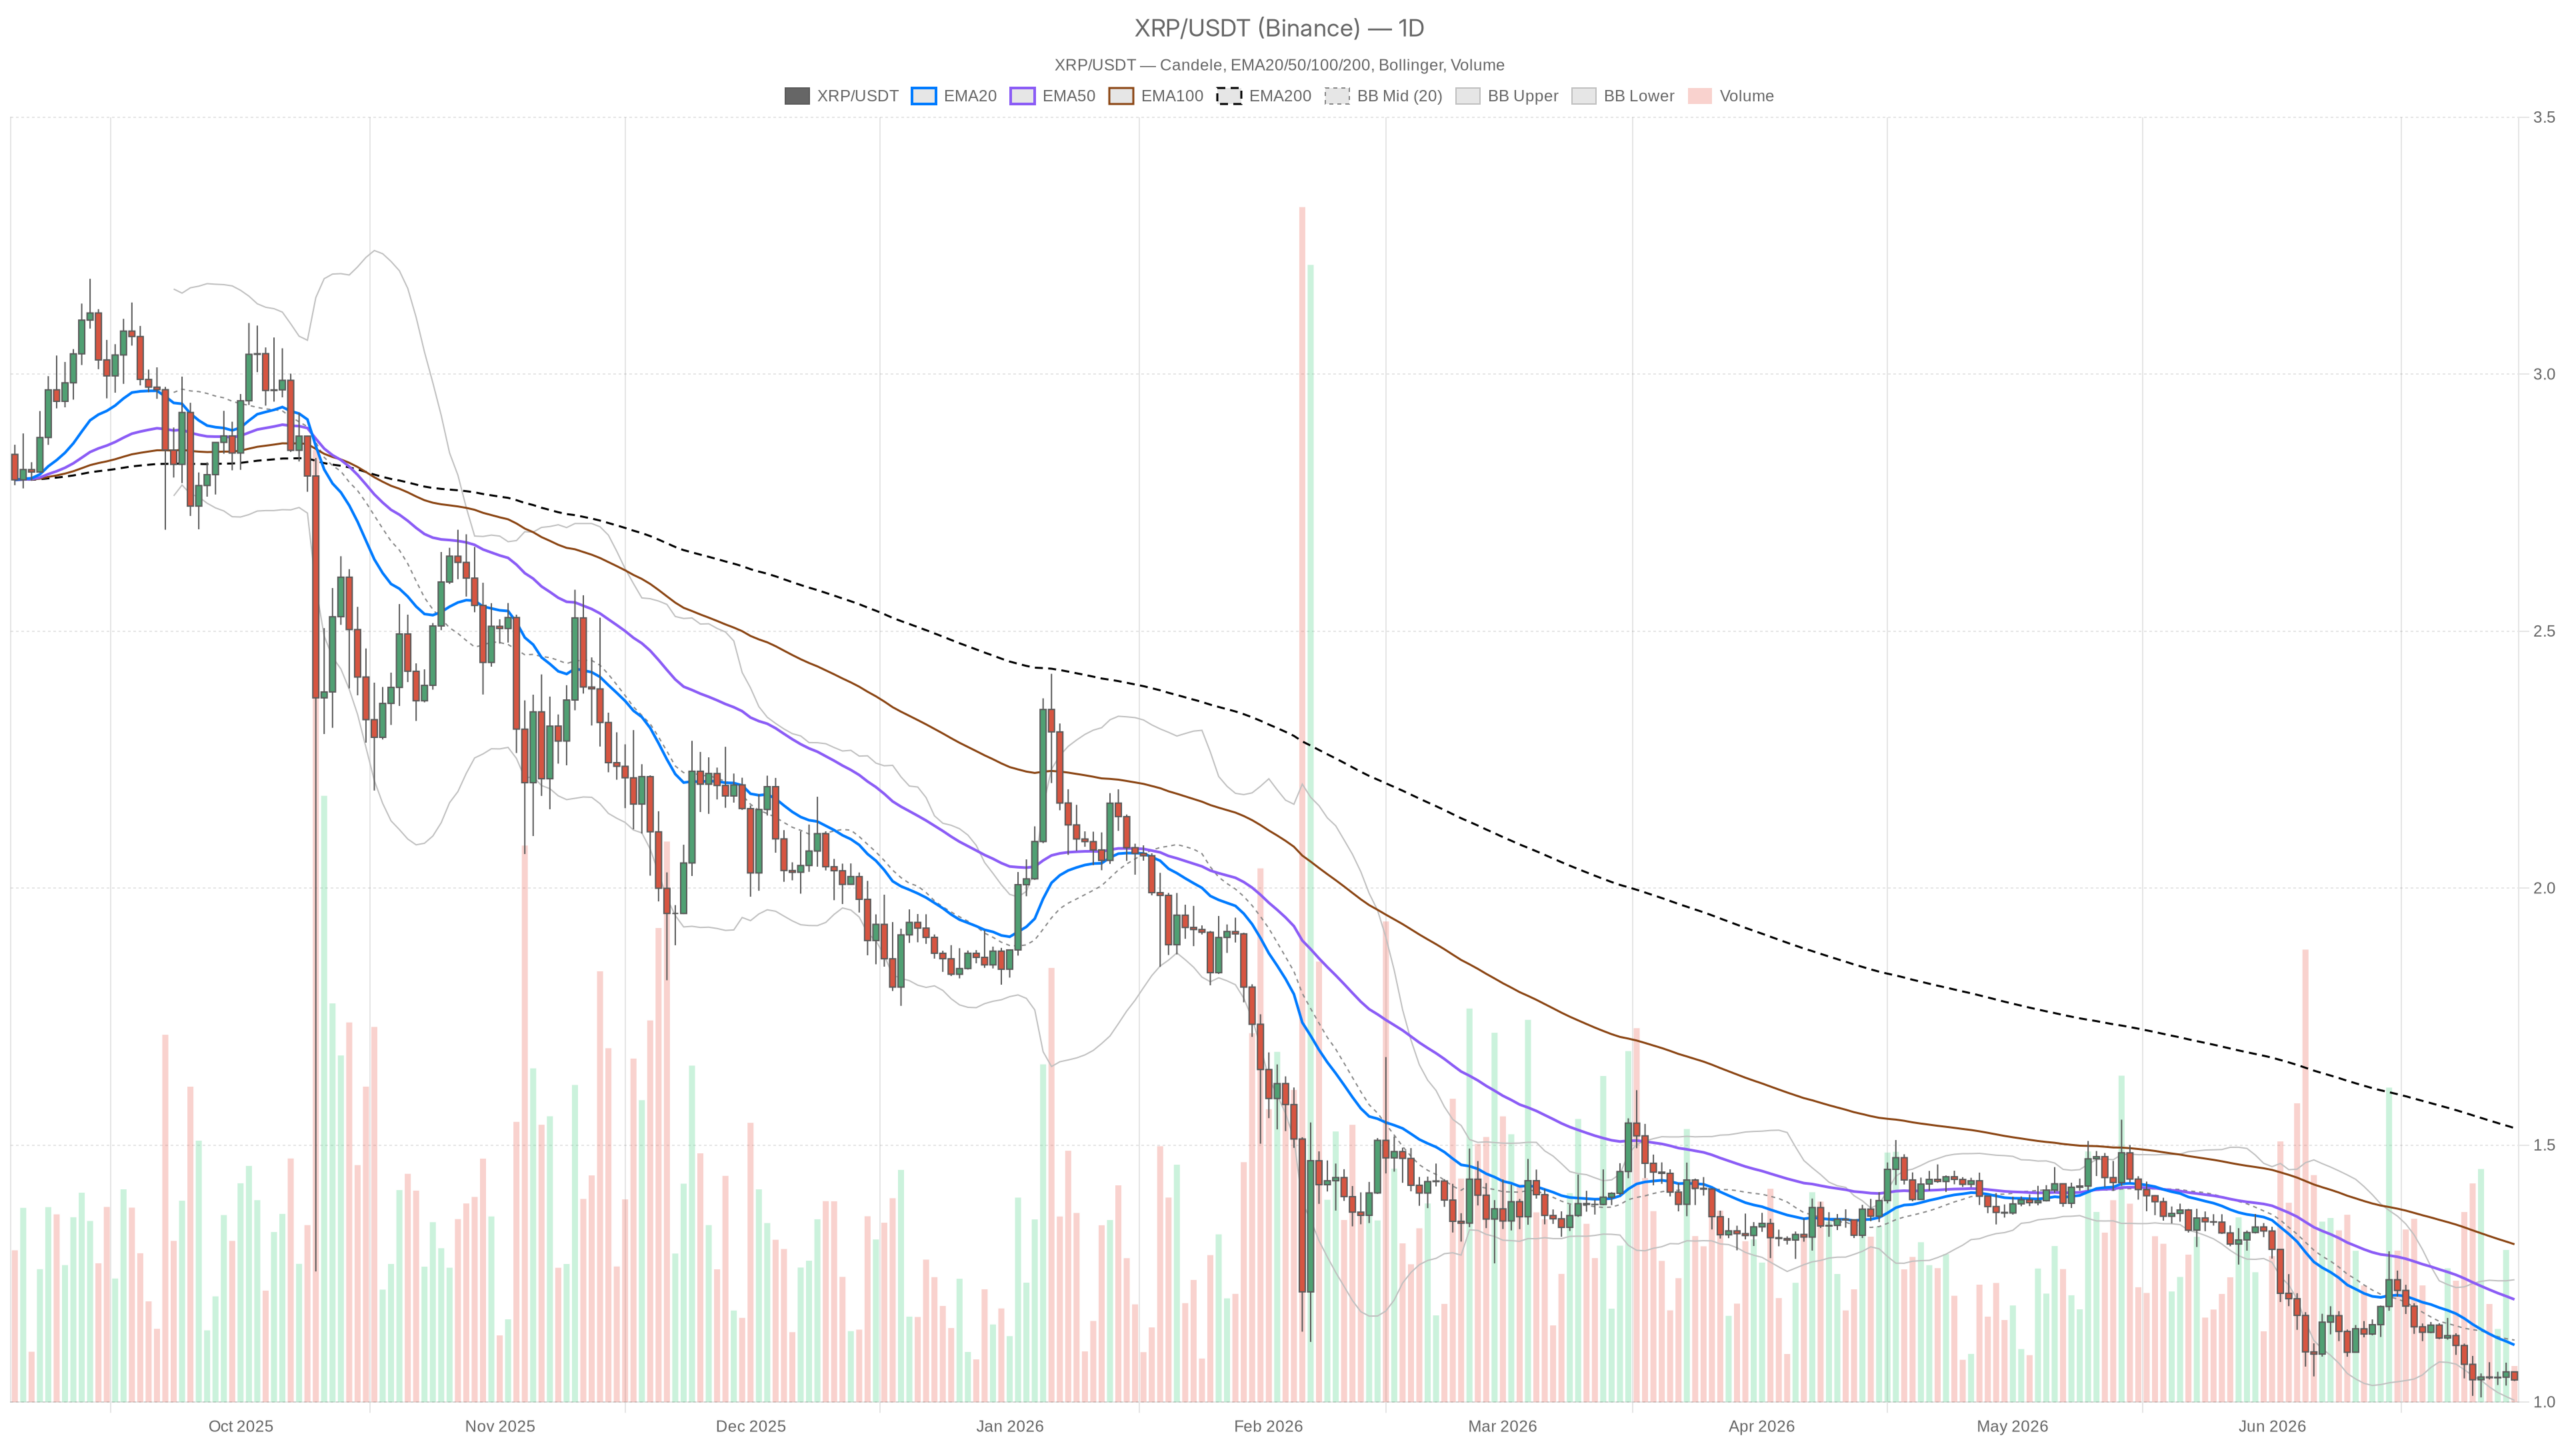
As of late June 30, 2026, XRP sits precisely on its daily support at $1.04, showing little desire to bounce. The broader market offers no comfort, and the Ripple price faces a defining moment where another wave of selling could trigger a meaningful breakdown.
Summary
Key takeaways
- XRP is trading at $1.04, exactly on its daily support, with no meaningful bounce materializing.
- All major moving averages are stacked above price in a textbook bearish alignment, with the 200-day EMA sitting at $1.53.
- The Fear & Greed Index reads 15 (Extreme Fear), while Bitcoin dominance is locked at 55.5%.
- A breakdown below $1.00 could open a rapid path toward the $0.88–$0.92 consolidation zone.
- No bullish confirmation exists on any timeframe; all three — daily, hourly, and 15-minute — remain in a bearish regime.
The Daily Chart: A Bearish Regime With No Relief in Sight
XRP’s daily chart confirms a textbook downtrend, with price trading below every major moving average and no immediate catalyst for a reversal visible. The Ripple price is trading well below its 20-day EMA at $1.11, its 50-day EMA at $1.20, and its 200-day EMA at $1.53. Each of those EMAs now functions as a ceiling rather than a floor, and the descending order leaves no ambiguity about the trend’s direction.
The daily RSI at 32.62 is flirting with oversold territory without quite getting there. That half-step matters: momentum is deeply negative, but a full flush has not yet occurred. Moreover, markets can stay oversold far longer than most traders expect, and in a Fear & Greed environment of 15, that is exactly what tends to happen.
The MACD on the daily chart is essentially flat, with both the line and signal at -0.05 and a histogram reading of zero. That flatness after a prolonged decline carries two possible meanings: either selling momentum is losing steam, or this is merely a pause before the next leg down. However, given the overall structure, the pause interpretation deserves skepticism until price proves otherwise.
Bollinger Bands tell a similarly cautious story. The lower band sits at $1.00 and the midline at $1.12, with price pressing the lower band. In trending markets, that band often acts as a rail rather than a bounce zone — meaning price can walk along it downward instead of reversing off it. Meanwhile, the upper band at $1.24 feels like a distant world from current levels.
Daily ATR stands at just $0.04, reflecting muted realized volatility. Low ATR during a decline often signals that the market is moving slowly and relentlessly in one direction, with no explosive reversal energy building. It also means stop losses can be placed tightly, though position sizing still warrants respect given the prevailing regime.
Daily pivot analysis clusters tightly: PP at $1.05, R1 at $1.05, and S1 at $1.04. The convergence of resistance and the pivot point just one cent above current price, with support right at the close, confirms how compressed this range has become. XRP is effectively sitting on the floor of its near-term pivot structure.
Hourly and 15-Minute Frames: Compression, Not Recovery
The lower timeframes show extreme compression rather than any sign of recovery, with all indicators aligned bearishly across the board. On the 1-hour chart, price sits at $1.04 while the 20-EMA, 50-EMA, and 200-EMA are stacked between $1.05 and $1.07 — all above current price. The hourly RSI at 40.85 is weak but not dramatically oversold, suggesting insufficient internal pressure for a sharp short-term bounce.
The 15-minute frame paints an even more compressed picture. All three EMAs converge at $1.05, while Bollinger Bands have essentially collapsed: upper and mid both at $1.05, lower at $1.04. The ATR reads near zero, a sign of almost total short-term volatility compression. Furthermore, the 15-minute RSI at 36.4 is soft without being technically oversold. This is execution-context territory, not thesis territory — and nothing on this frame currently justifies a long position of meaningful size.
The multi-timeframe takeaway is unambiguous: all three timeframes remain in a bearish regime simultaneously, with zero divergence between them. That alignment itself is the signal.
The Bullish Scenario
The bullish case for XRP depends entirely on the $1.00 level holding as support and attracting aggressive buyers. A daily close back above $1.05 — the current pivot and resistance cluster — would be the first credible sign that sellers are stepping back. From there, reclaiming the 20-day EMA at $1.11 would shift short-term structure from bearish to potentially neutral, opening the door toward the 50-day EMA at $1.20 as the next genuine test.
That said, this scenario gets invalidated immediately if $1.00 breaks on meaningful volume. Below that round number, there is very little historical structure to lean on, and the move lower could unfold far faster than the slow grind witnessed in recent days.
The Bearish Scenario
The bearish case remains the path of least resistance right now, with a breakdown below $1.03 likely to accelerate selling toward the round number. A failure to hold $1.04 intraday followed by a close below $1.03 would confirm the compression breakdown. The $1.00 level would then become the immediate target, and a clean break of that threshold would open a deeper pullback toward the $0.88–$0.92 zone — a region that represented consolidation earlier in the year.
In an Extreme Fear environment with Bitcoin dominance rising, altcoin selling pressure can accelerate quickly and without warning. However, this bearish scenario gets invalidated by a strong daily close above $1.11, accompanied by an RSI move back above 45–50 and a MACD histogram turning positive. Anything short of that should be treated as a relief rally within a downtrend, not a trend change.
Where Things Stand
XRP sits at a compressed inflection point where the broader market backdrop of Extreme Fear and rising Bitcoin dominance favors a downside resolution over an upside one. The compression across all three timeframes suggests something must give soon, and the most probable outcome — continued pressure at or below current levels — is also the least rewarding to trade. The setup for a reversal exists in theory but lacks any confirmation in practice.
Traders need to be honest about what the chart is actually showing. There is no hidden bullish divergence, no volume spike hinting at accumulation, and no macro tailwind for altcoins right now. The $1.00 level is the line in the sand. How price behaves around it — whether it holds, bounces sharply, or cuts through — will define XRP’s next meaningful move. Until then, patience carries more value than conviction, and position sizing should reflect the reality that this market rewards caution, not aggression.
FAQ
What is the current support level for XRP?
XRP is sitting precisely on its daily support at $1.04, which also aligns with the daily S1 pivot. Below that, the psychologically significant $1.00 round number — reinforced by the daily lower Bollinger Band — represents the next major support zone.
What happens if XRP breaks below $1.00?
A clean break below $1.00 on meaningful volume would likely open a rapid path toward the $0.88–$0.92 zone, a region that served as a consolidation area earlier in the year. With very little historical structure below $1.00, the move lower could accelerate quickly.
Is XRP in a confirmed downtrend?
Yes. XRP is trading below its 20-day EMA ($1.11), 50-day EMA ($1.20), and 200-day EMA ($1.53), with all three stacked in descending order above price — a textbook bearish alignment that confirms the downtrend across every major timeframe.
What would signal a bullish reversal for XRP?
A credible bullish signal would require a daily close above $1.05 followed by a reclaim of the 20-day EMA at $1.11, ideally accompanied by an RSI recovery above 45–50 and a positive MACD histogram. Without these confirmations, any rally should be viewed as a relief move within the prevailing downtrend.
Disclaimer: This article is for informational purposes only and does not constitute financial advice, an investment recommendation, or a solicitation to buy or sell any financial instrument or cryptocurrency. The analysis provided is not indicative of future results. Investing in crypto assets and financial markets carries a high risk of capital loss. Always do your own research (DYOR) and consult a qualified financial advisor before making any decision.
Article produced with the assistance of artificial intelligence and reviewed by the editorial team.