

Tencent stock faces sustained selling pressure as TCTZF closed at $55.05 on June 29. Price sits below every major moving average across daily and hourly timeframes. Momentum indicators remain negative across the board. The bearish regime stays intact until buyers reclaim the $56.37 level.
Summary
Key takeaways
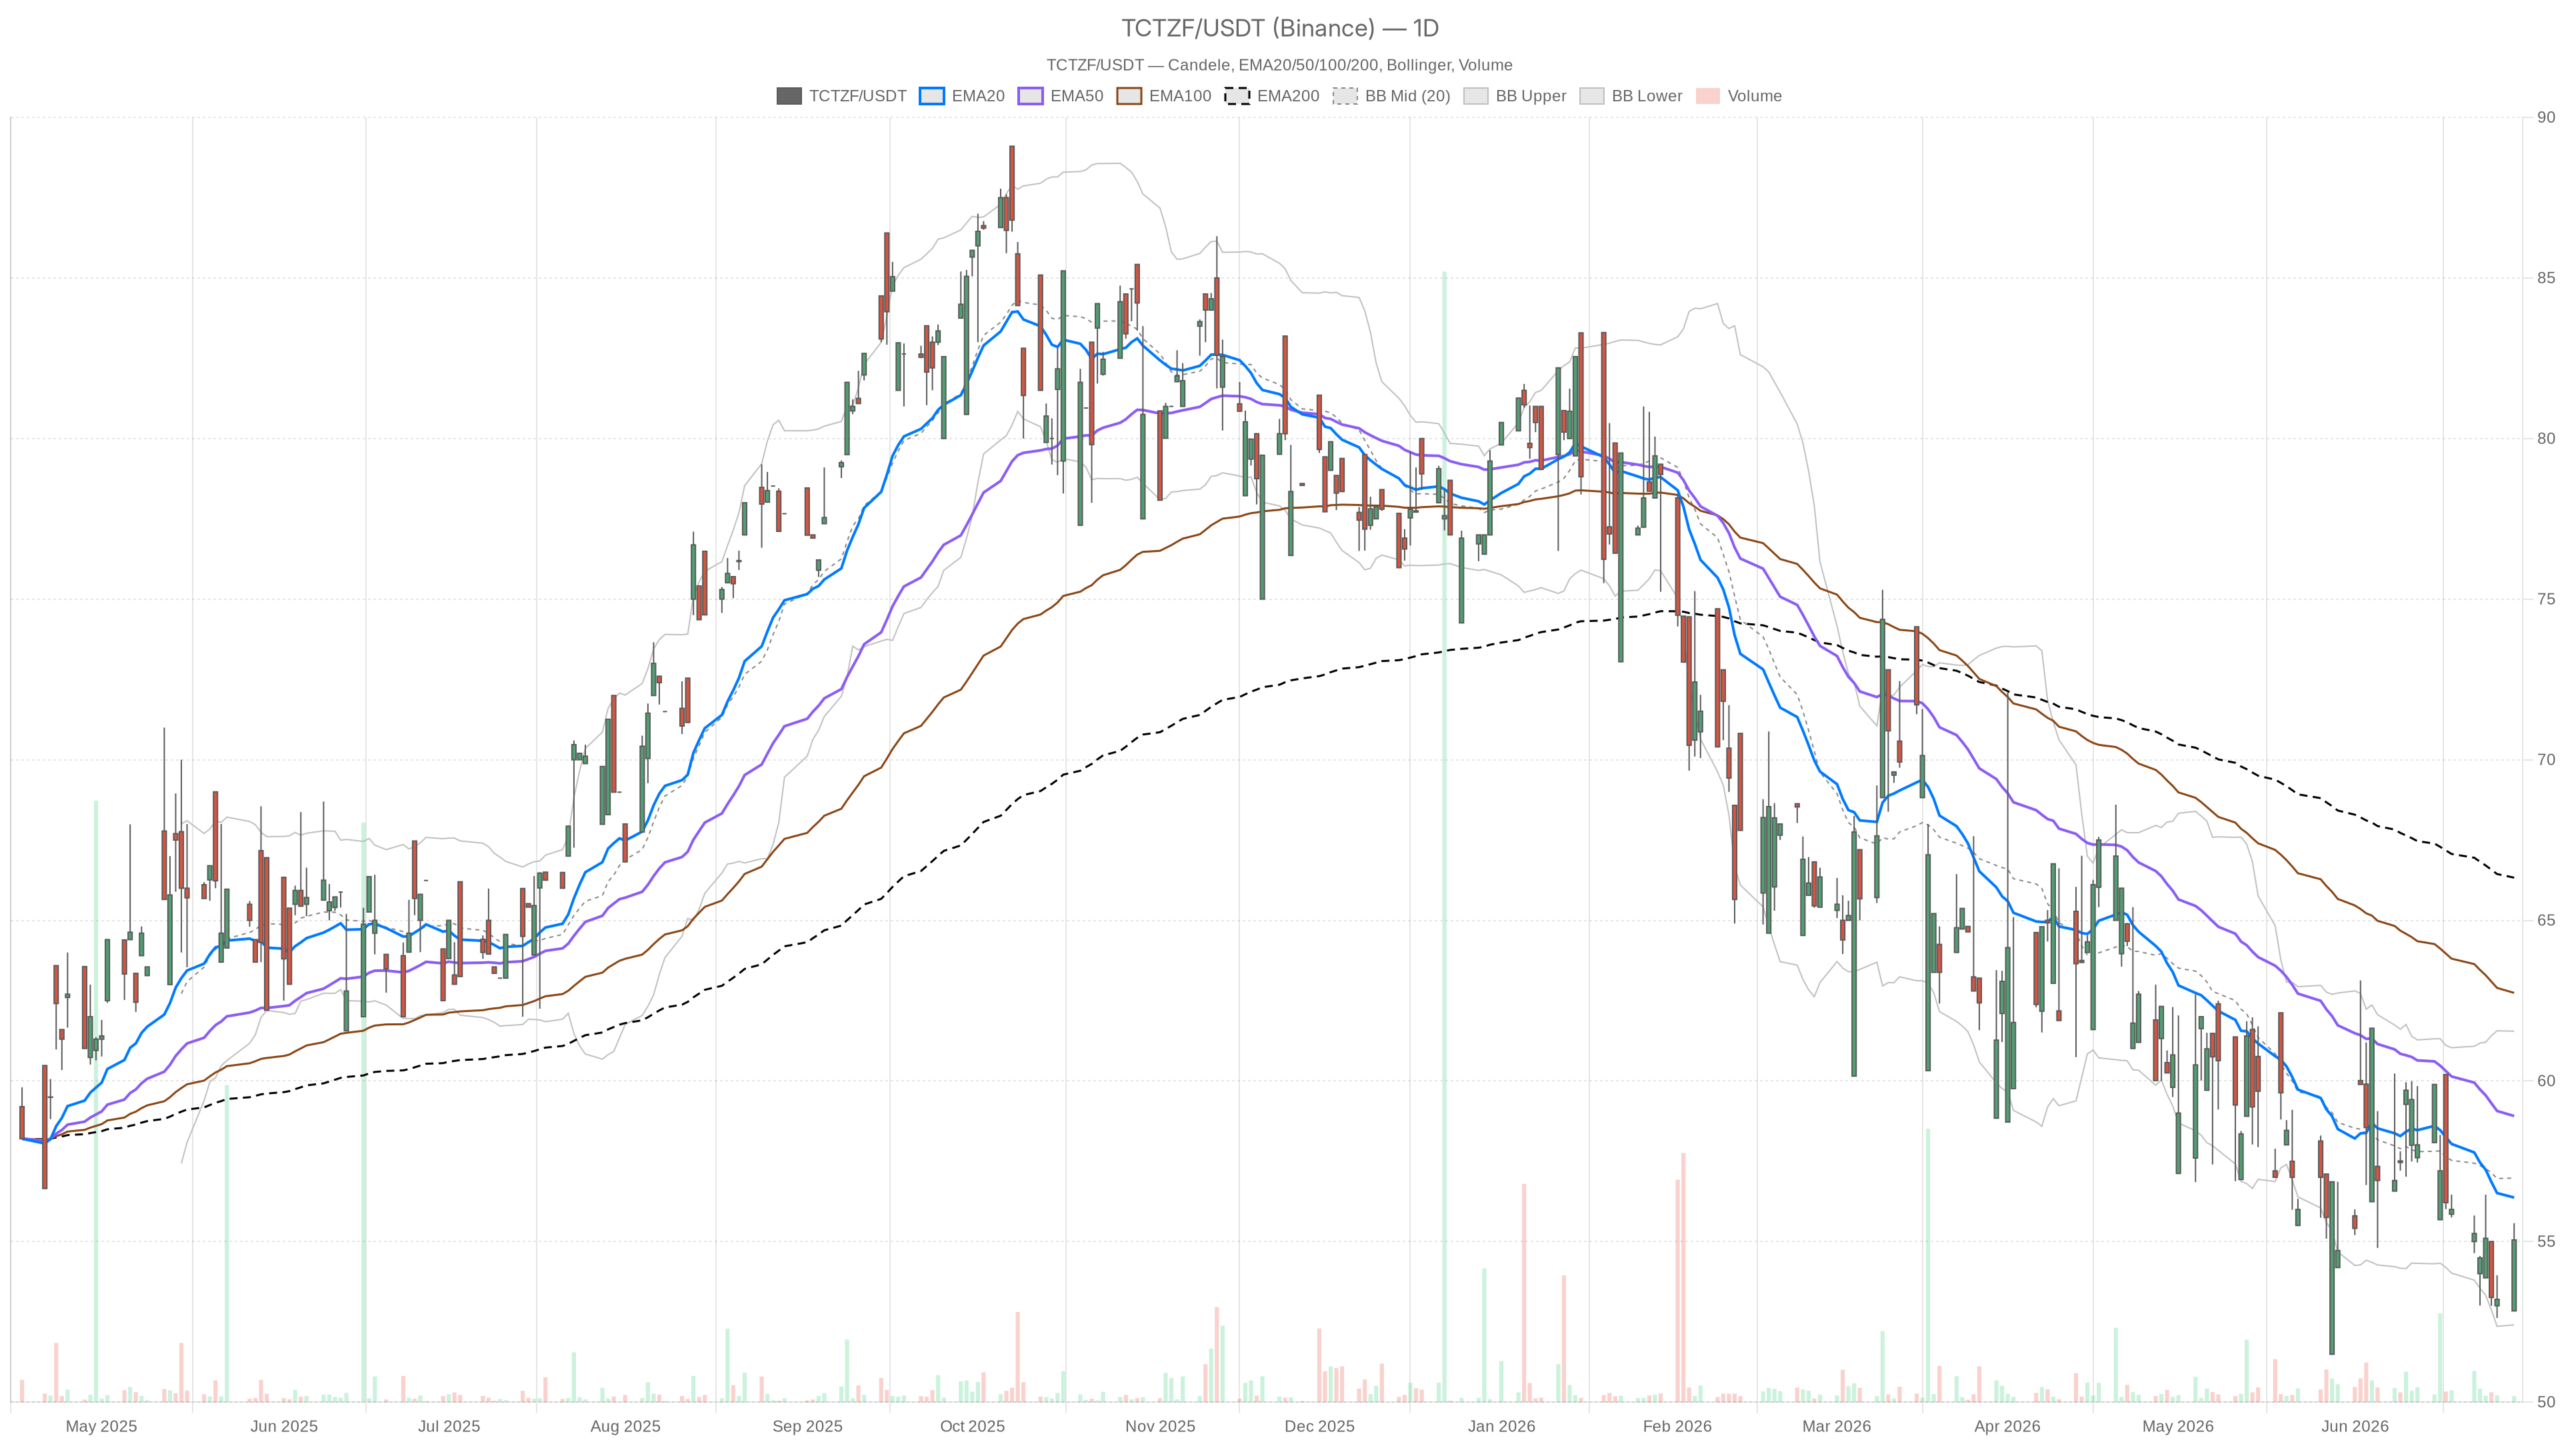
- TCTZF closed at $55.05 on June 29, trading beneath EMA20 ($56.37), EMA50 ($58.91), and EMA200 ($66.33) in a clean bearish stack.
- Daily RSI at 44.59 and a negative MACD confirm downside momentum is still building, not fading.
- Hourly MACD at -0.34 is more negative than the daily reading, showing short-term momentum deteriorating faster.
- Bulls need a closing break above $56.37 to challenge the bearish regime; bears target the $52.41 Bollinger lower band as the next support floor.
- All three timeframes — daily, hourly, and 15-minute — align bearishly, an unusual unanimity that carries weight.
Daily Chart: Bearish EMA Alignment Keeps Tencent Stock Under Pressure
TCTZF’s daily chart presents a clean bearish EMA stack. Price at $55.05 sits beneath EMA20 at $56.37, EMA50 at $58.91, and EMA200 at $66.33. This alignment — where near-term averages sit below long-term ones and price trades below all three — rarely resolves quickly to the upside.
The bounce from the intraday low of $52.84 on June 29 is worth noting. However, it does not change the broader regime. The daily close near $55.05 remains firmly in the lower half of the Bollinger Bands. The midline sits at $56.98 and the lower band at $52.41. Price is gravitationally pulled toward support rather than resistance.
Momentum Indicators Deepen the Bearish Case
The daily RSI at 44.59 confirms weakness without reaching oversold extremes. No strong mean-reversion signal exists here. Meanwhile, the MACD is negative across the board. The line sits at -1.34, below the signal at -1.08, with a histogram reading of -0.26. This confirms that downside momentum is still building, not fading.
Support and Resistance Levels to Watch
Daily ATR of $2.29 signals moderate volatility — enough to produce sharp intraday swings but not extreme conditions. The daily pivot analysis places the pivot point at $54.49, with R1 resistance at $56.13 and S1 support at $53.40. Notably, R1 at $56.13 immediately coincides with EMA20 near $56.37. This creates a meaningful resistance cluster just overhead. The June 29 close at $55.05 sits marginally above the pivot, a small positive overshadowed by the heavier structural resistance above.
Hourly Structure Confirms and Amplifies the Downtrend
The hourly chart reinforces the bearish case without offering any counterargument. The last hourly print shows TCTZF flat at $53.20 as of June 26. This is notably below the daily close, suggesting the June 29 recovery happened in thin conditions. On the 1H chart, EMA20 stands at $55.50, EMA50 at $57.36, and EMA200 at $65.52. Price sits deeply buried beneath all three.
The 1H RSI of 39.09 approaches oversold territory but has not crossed into it yet. At the same time, sellers still have room to push lower without triggering an automatic mean-reversion bounce. This leaves the intraday trend vulnerable to further erosion.
MACD Divergence Signals Accelerating Short-Term Weakness
The hourly MACD is notably more negative than the daily equivalent. The line at -1.14 diverges further from the signal at -0.80, with a histogram of -0.34. Therefore, short-term momentum is deteriorating faster than the daily trend itself. In other words, the intraday structure confirms and amplifies the daily weakness rather than providing a counterargument.
15-Minute Chart Offers Execution Context Only
On the 15-minute chart, the most recent bar shows the same $53.20 flat print. RSI sits at 38.43 with a similarly negative MACD configuration. Price hovers just above the 15m Bollinger lower band of $52.05. That proximity could produce a short-term bounce. However, any relief rally from this area should be viewed as a seller’s reentry point. It would not signal a genuine trend reversal. The 15m timeframe offers execution context only.
Bullish and Bearish Scenarios for Tencent Stock
For buyers to take control, TCTZF must reclaim the daily EMA20 at $56.37 on a closing basis. A move through R1 at $56.13 with volume confirmation would provide the first structural signal that conditions are changing. Beyond that, a close back above EMA50 at $58.91 would represent a genuine regime shift. On the RSI side, a recovery above 50 on the daily timeframe would be needed. That would confirm momentum is turning in favor of bulls. None of these conditions are currently in place.
The bearish scenario, on the other hand, is considerably better supported by current evidence. A failure to hold the $53.40 S1 level would open the door to further losses. More importantly, a breach of the $52.41 Bollinger lower band on the daily chart would confirm accelerating downside. The overall regime is tagged as bearish across all three timeframes. That unanimity is unusual and carries meaningful weight. There are no conflicting signals to generate doubt. All available evidence aligns in the same direction. Until the $56.13–$56.37 resistance zone is clearly broken, Tencent stock appears to remain in a distribution phase with sellers maintaining the upper hand.
FAQ
What is the current trend for Tencent stock (TCTZF)?
Tencent stock is in a confirmed bearish trend across daily, hourly, and 15-minute timeframes. TCTZF trades below all major moving averages, with EMA20 at $56.37, EMA50 at $58.91, and EMA200 at $66.33. Momentum indicators such as RSI and MACD reinforce the negative outlook.
What key levels should traders watch on TCTZF?
The critical resistance zone sits between $56.13 (R1 pivot) and $56.37 (EMA20). A closing break above this cluster would be the first structural sign of bullish change. On the downside, S1 support at $53.40 and the daily Bollinger lower band at $52.41 are the key levels to hold. A breach below $52.41 would open the door to deeper losses.
Is Tencent stock oversold and due for a bounce?
Not yet. The daily RSI at 44.59 and hourly RSI at 39.09 are approaching but have not reached oversold territory. Sellers still have room to push lower without triggering an automatic mean-reversion bounce. Any short-term relief rally should be viewed with skepticism until the $56.13–$56.37 resistance zone is broken.
What would signal a trend reversal for TCTZF?
A genuine trend reversal would require TCTZF to reclaim the daily EMA20 at $56.37 on a closing basis, followed by a move above EMA50 at $58.91. The daily RSI would also need to recover above the 50 level to confirm momentum is turning bullish.
Disclaimer: This article is for informational purposes only and does not constitute financial advice, an investment recommendation, or a solicitation to buy or sell any financial instrument or cryptocurrency. The analysis provided is not indicative of future results. Investing in crypto assets and financial markets carries a high risk of capital loss. Always do your own research (DYOR) and consult a qualified financial advisor before making any decision.
Article produced with the assistance of artificial intelligence and reviewed by the editorial team.