

Siemens Energy Stock (ENR) sits at a crossroads. The daily chart shows a stock reclaiming key levels with genuine momentum. Yet intraday price action is fading on June 29. Short-term indicators flash warnings. The daily bias remains moderately bullish — but the hourly picture complicates the near-term setup.
Summary
Key takeaways
- ENR closed at $21.67 on June 29, pulling back from an intraday high of $22.52.
- Daily RSI at 61.81 confirms sustained buying pressure without overbought conditions.
- Institutional shareholder Aqua Capital disclosed a significant purchase on June 24, triggering a 5.1% jump.
- Hourly MACD turned negative, signaling short-term momentum deterioration.
- Key support sits at $21.39; a breakdown could open a path toward $20.32.
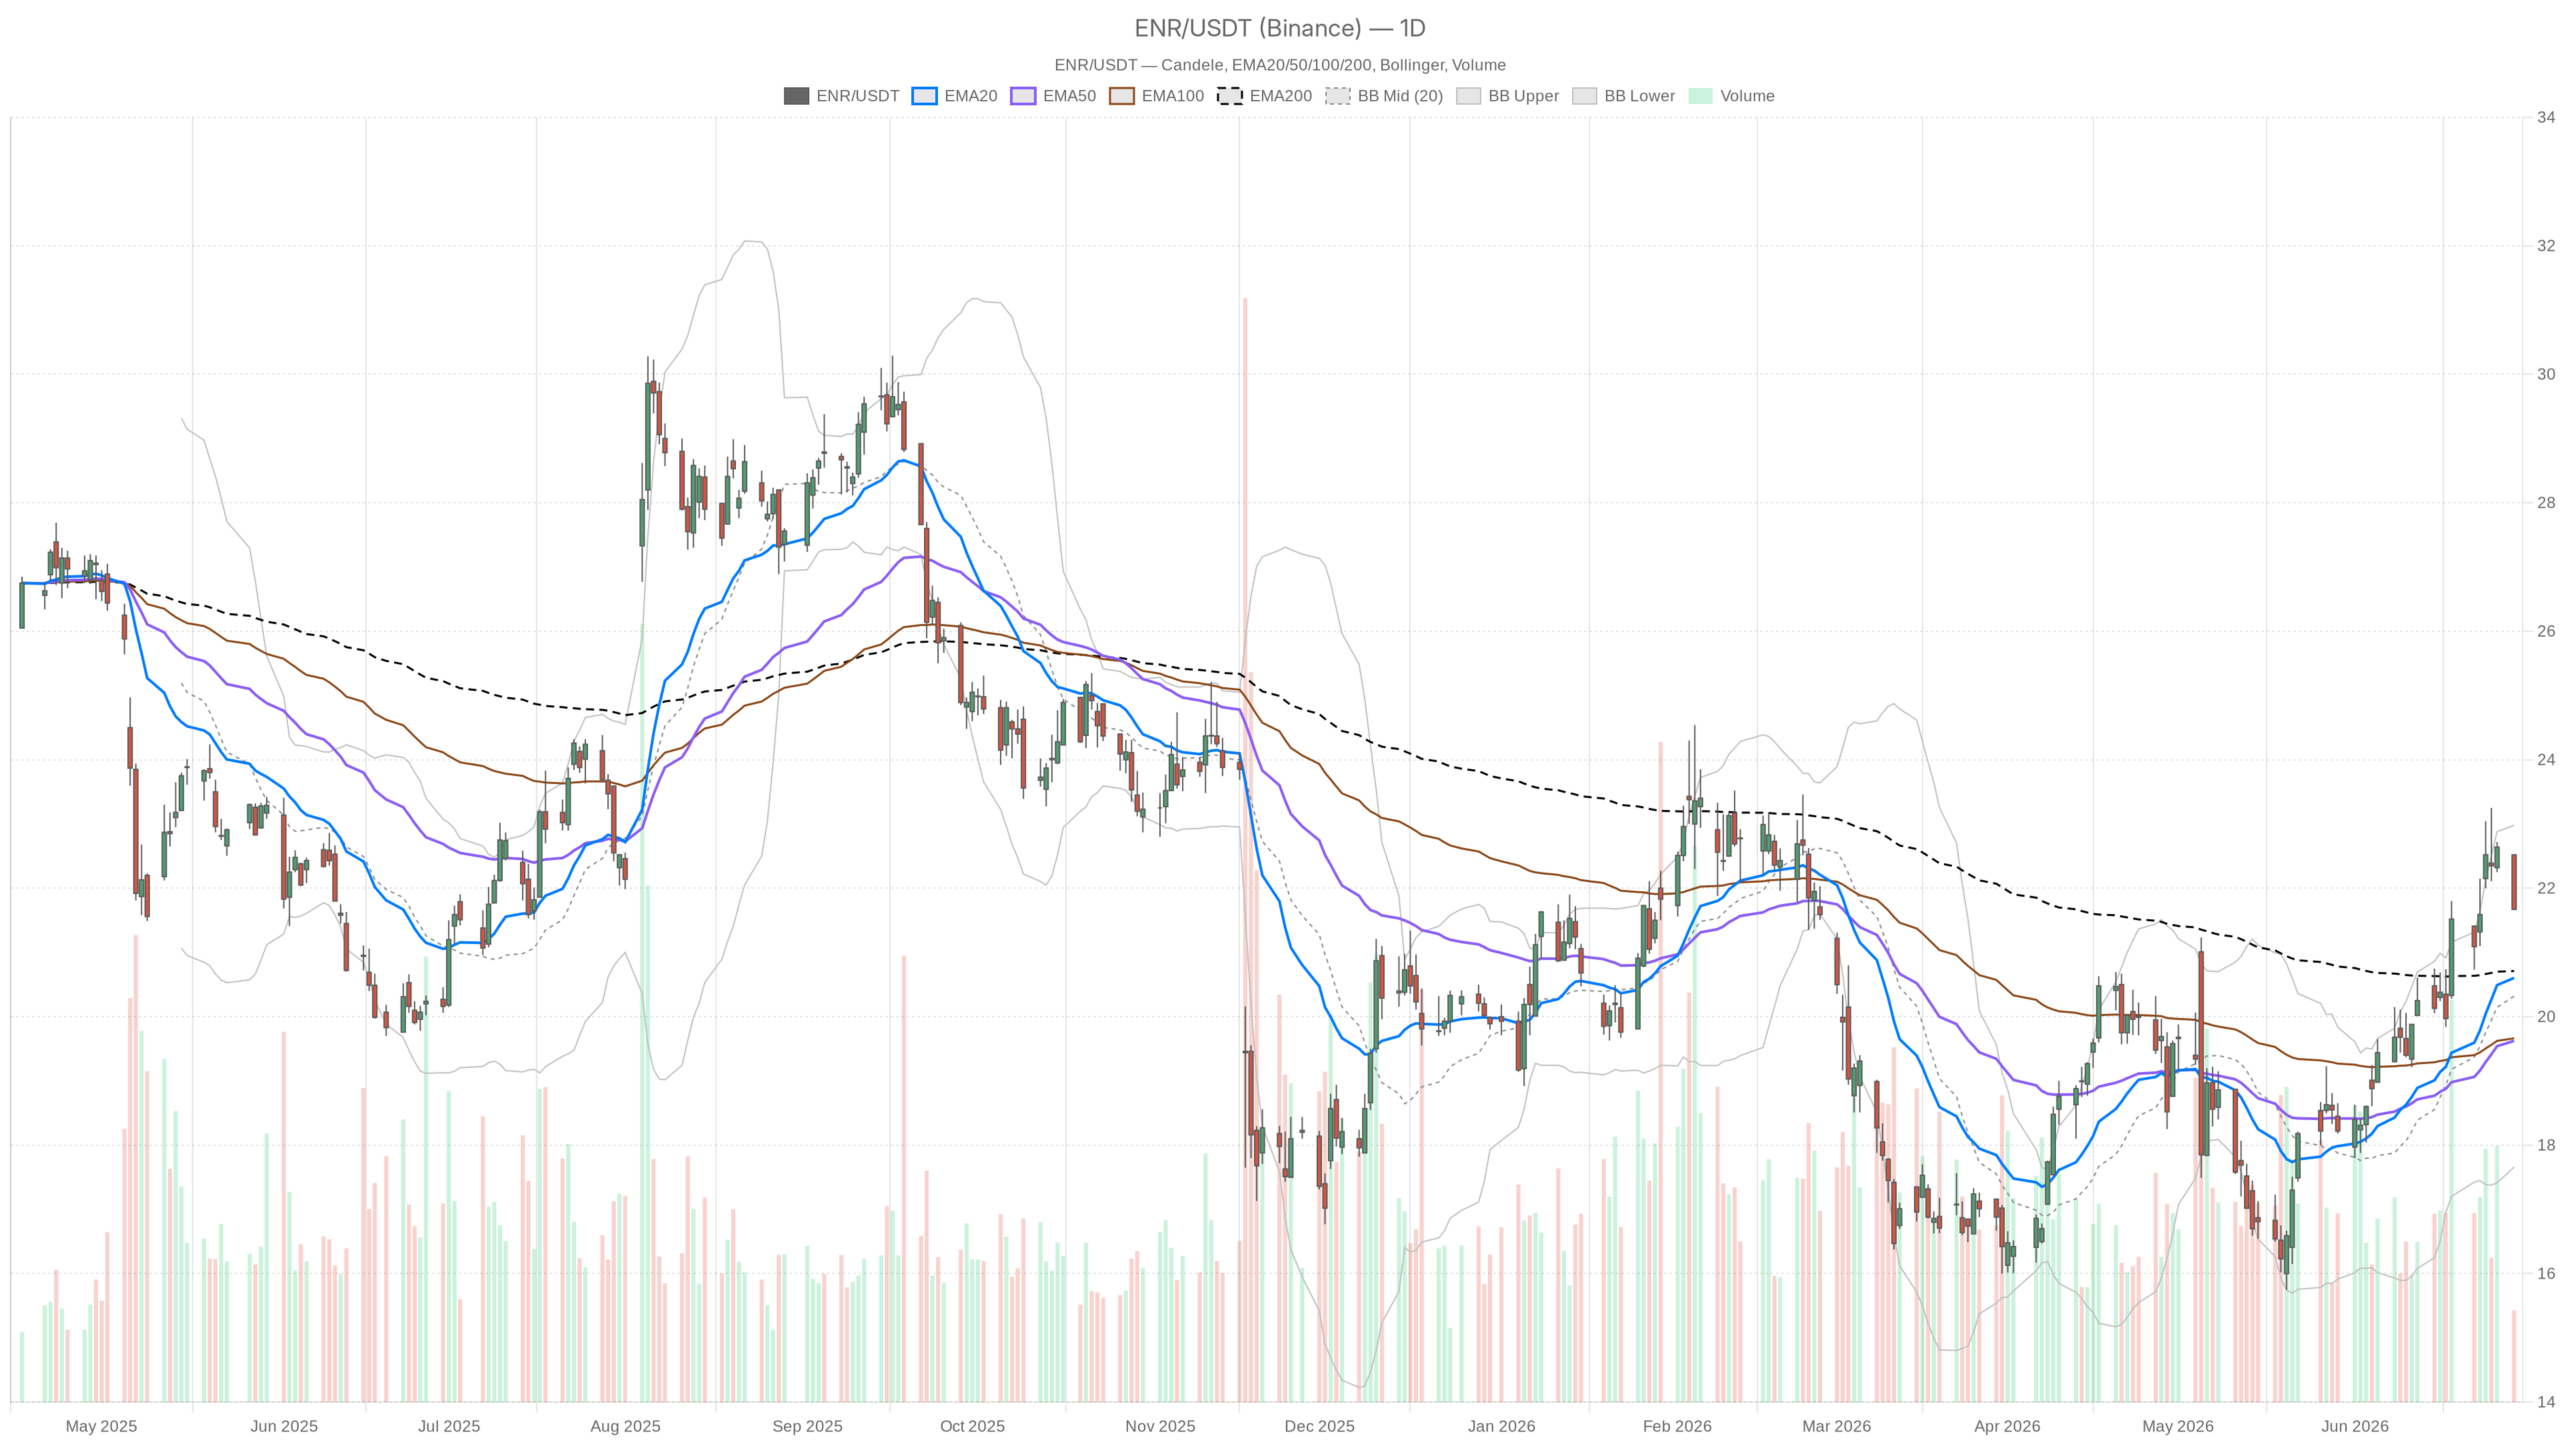
Daily Timeframe: Siemens Energy Stock Holds Constructive Structure
The daily structure for Siemens Energy Stock remains constructive despite the June 29 rejection. ENR holds above all three key moving averages, confirming the medium-term uptrend is intact. The stock closed at $21.67, pulling back from an intraday high of $22.52. That rejection surrendered the full day’s range. Still, price trades above the EMA20 at $20.60 and EMA50 at $19.62. The EMA200 sits at $20.71. ENR holding above it signals recovery from a longer-term downtrend. It also points to an emerging bullish regime.
Momentum Indicators and Volatility Context
The daily RSI at 61.81 is firm without being overbought. It reflects sustained buying pressure with room to extend before hitting exhaustion territory. Meanwhile, the MACD line at 0.99 sits above its signal at 0.79, with a positive histogram of 0.19. That configuration supports ongoing momentum — not yet peaking. Bollinger Bands show ENR trading near the upper band at $22.98, with the midline at $20.32. The stock presses the upper boundary of a wide band — historically signaling either strong trend continuation or a near-term pullback toward the midline. The ATR of 0.90 implies meaningful daily volatility, so swings of nearly a dollar in either direction are entirely normal.
Pivot Levels and Near-Term Signals
Daily pivot analysis places the pivot point at $21.95, with resistance at $22.24 and support at $21.39. Notably, the close at $21.67 sits below the daily pivot — a subtle sign of near-term weakness despite the longer-term bullish context. The daily regime remains classified as neutral. This aligns with a market trending higher but not yet breaking into a confirmed trending phase.
Hourly Timeframe: Intraday Deterioration Emerges
The hourly chart shows clear intraday deterioration for Siemens Energy Stock. Price has slipped below its short-term trend averages, pointing to a near-term momentum shift. ENR’s last hourly candle closed at $21.67 with a high of $21.89 — another session where price failed to hold early gains. The hourly EMA20 at $22.11 and EMA50 at $21.82 now sit above current price. This means ENR has slipped below short-term trend averages on this timeframe, a bearish signal for intraday momentum.
The hourly RSI at 40.51 approaches oversold territory without yet triggering a bounce. It reflects sellers controlling the most recent trading hours. On the other hand, the EMA200 on the 1H sits at $20.23, well below current price. That deeper support level confirms the broader uptrend remains structurally sound, even as the surface softens. However, the hourly MACD reinforces caution. The line at -0.07 has crossed below the signal at 0.05, generating a negative histogram of -0.12. This is a classic short-term momentum reversal signal. It does not negate the daily trend but suggests this is not an ideal entry point for intraday longs.
Hourly Bollinger Bands show price hovering near the lower band at $21.57, which could offer technical support if buyers return. Meanwhile, hourly pivot levels tighten the picture further. The pivot point at $21.74, resistance at $21.82, and support at $21.60 create a compressed zone. ENR is sandwiched in this narrow range, and a clean break in either direction will likely define the next short-term move.
15-Minute Chart: Execution-Level Context
The 15-minute chart offers execution-level context for Siemens Energy Stock. Price hugs the lower Bollinger Band, with the RSI nearing oversold conditions — but no reversal signal has yet confirmed. ENR trades near $21.68, close to the session close of $21.67. The RSI has dropped to 34.05, approaching oversold territory. Interestingly, the MACD histogram on the 15m has turned marginally positive at 0.01, hinting at a very early attempt at stabilization. This is not a reversal signal by itself, but it suggests selling pressure may be momentarily losing steam.
The 15m EMA structure remains bearish. Price sits below the EMA20 at $21.87 and EMA50 at $22.06. The EMA200 at $21.77 acts as overhead resistance rather than support. For any intraday recovery, ENR first needs to reclaim $21.77, then $21.82, before the short-term picture improves meaningfully.
The Catalyst: Institutional Buying Backs Siemens Energy Stock
On June 24, shares of Siemens Energy Stock jumped 5.1% after major shareholder Aqua Capital, Ltd. disclosed a significant purchase of company stock. Institutional insider buying of this nature reflects genuine conviction in the company’s valuation and near-term trajectory. That move likely catalyzed the push toward $22.52 seen on June 29. Therefore, the subsequent pullback from that high looks more like profit-taking after a sharp run rather than a structural reversal.
Bullish Scenario for Siemens Energy Stock
The bullish case for Siemens Energy Stock hinges on holding daily support and reclaiming the pivot. If ENR stabilizes above the $21.39 daily support and reclaims the $21.95 pivot, a retest of $22.24 resistance opens up. The upper Bollinger Band near $22.98 could also come into play. The daily MACD and RSI structure supports this scenario. Continued institutional accumulation, following the Aqua Capital disclosure, would reinforce it further. A daily close above $22.24 would deliver meaningful technical confirmation of trend continuation.
Bearish Scenario: Downside Risks Remain
The bearish case cannot be dismissed. ENR closed at session lows on June 29, surrendering the entire intraday gain. The hourly MACD has turned negative, and short-term EMAs sit overhead. If $21.39 — the daily S1 support level — gives way on a closing basis, the next meaningful support cluster lies near the Bollinger midline around $20.32. That would represent a roughly 6% correction from current levels. In that scenario, the daily RSI would likely cool to neutral readings, and the bullish narrative would need time to rebuild.
Positioning and Final Assessment
Overall, Siemens Energy Stock remains in a bullish daily structure, supported by institutional buying interest and constructive momentum indicators on the longer timeframe. However, the hourly and 15-minute charts point to near-term selling pressure that has not yet found a floor. The conflict between timeframes is real — it calls for patience rather than urgency. Traders watching for long entries should wait for a confirmed bounce off $21.39–$21.60 support, ideally accompanied by hourly MACD stabilization. Those already long should respect the $21.39 level as a key risk marker. Volatility is elevated here, with daily ATR at $0.90. The compression on the 15-minute chart suggests a directional move is approaching. The daily trend earns the benefit of the doubt — but the intraday structure demands caution.
FAQ
What is the current trend for Siemens Energy Stock?
Siemens Energy Stock (ENR) maintains a moderately bullish daily structure, trading above its EMA20, EMA50, and EMA200. However, intraday pressure on the hourly and 15-minute charts has introduced near-term caution. The stock closed at $21.67 on June 29 after pulling back from a $22.52 intraday high.
What are the key support levels for ENR right now?
The most important support level is $21.39 — the daily S1 pivot support. Below that, the Bollinger Band midline near $20.32 represents the next meaningful support cluster. On the hourly chart, the lower Bollinger Band at $21.57 provides nearer-term technical support.
Did institutional buying recently affect Siemens Energy Stock?
Yes. On June 24, major shareholder Aqua Capital, Ltd. disclosed a significant purchase of ENR shares, triggering a 5.1% price jump. This institutional buying signal reflects conviction in the company’s valuation and helped drive the subsequent rally toward $22.52.
Is now a good time to enter Siemens Energy Stock?
The daily trend supports a bullish bias, but the hourly MACD has turned negative and short-term indicators show deterioration. Traders may want to wait for a confirmed bounce off the $21.39–$21.60 support zone with hourly MACD stabilization before entering. Existing longs should monitor $21.39 as a key risk level.
Disclaimer: This article is for informational purposes only and does not constitute financial advice, an investment recommendation, or a solicitation to buy or sell any financial instrument or cryptocurrency. The analysis provided is not indicative of future results. Investing in crypto assets and financial markets carries a high risk of capital loss. Always do your own research (DYOR) and consult a qualified financial advisor before making any decision.
Article produced with the assistance of artificial intelligence and reviewed by the editorial team.