




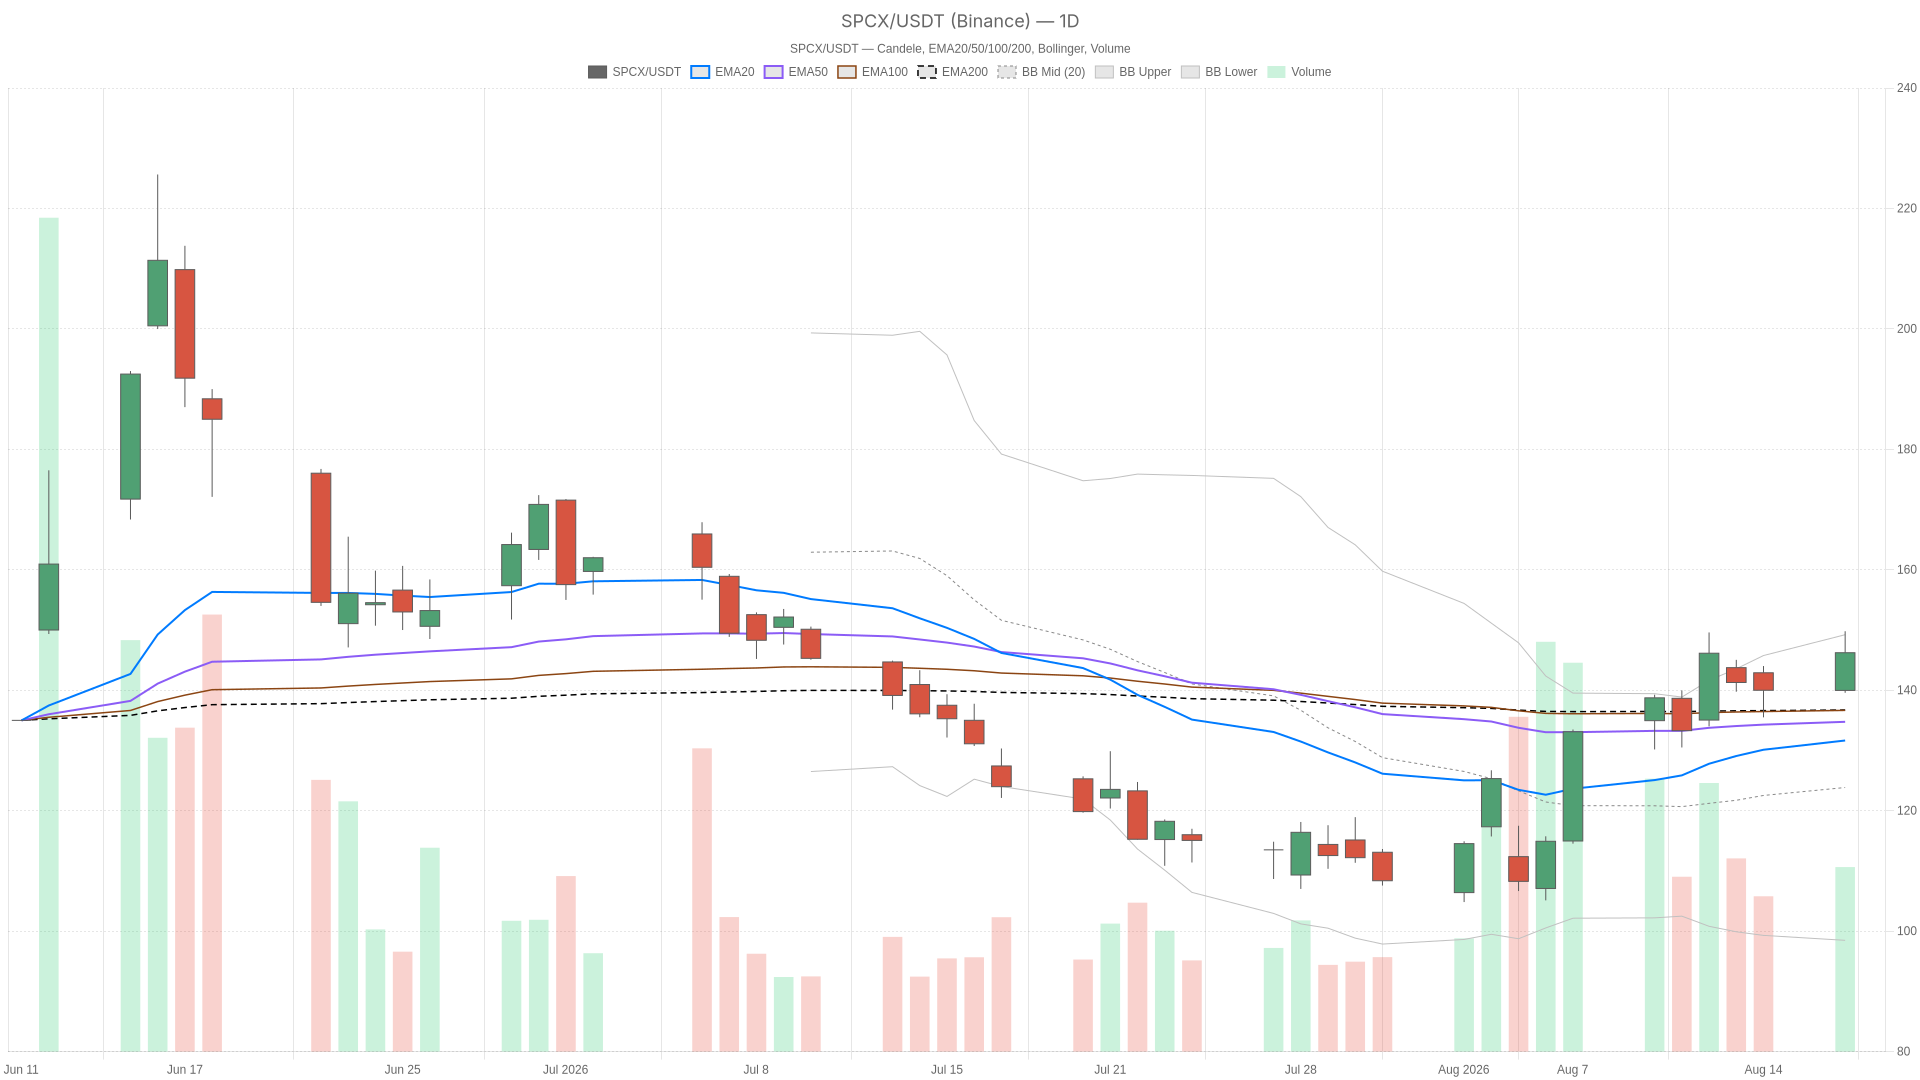
SpaceX stock surged more than 5% on Monday after a 13F filing revealed Google, Nvidia and BlackRock among shareholders. SPCX closed at $146.23, above key moving averages and near the $149.80 session high. The post-IPO structure leans bullish, though volatility remains pronounced.
Summary
Key takeaways
- SPCX surged more than 5% on Monday, closing at $146.23 after a 13F filing revealed Google, Nvidia and BlackRock as shareholders.
- The daily EMA20, EMA50 and EMA200 are stacked bullishly, with RSI14 at 58.92 and a positive MACD histogram of 4.30.
- The daily regime remains tagged neutral despite bullish alignment, with ATR14 at 10.82 signaling double-digit daily swings.
- Bullish confirmation requires clearing R1 at 150.83; losing the 145.20 daily pivot would weaken the setup.
- Retail investors sold a net $4.5 million of SPCX on August 7, the first net selling day since debut, per Vanda Research data cited by Reuters.
SpaceX Stock Daily Trend: Bullish Structure With a Neutral Tag
SpaceX stock’s daily structure leans bullish, with price trading above all three key moving averages. The EMA20 (131.66), EMA50 (134.76) and EMA200 (136.72) form a clean stacked alignment that typically reflects an established uptrend.
Meanwhile, momentum indicators reinforce that view without flashing overbought extremes. RSI14 at 58.92 is constructive but leaves room before overbought territory becomes a concern. The MACD line at 1.63 versus a signal line at -2.66 produces a histogram of 4.30, confirming strong upside momentum on this timeframe.
However, the system still tags the daily regime as “neutral” despite this bullish alignment. That is worth pausing on. With an ATR14 of 10.82, SPCX is swinging by double-digit dollar amounts on a daily basis. That kind of volatility can keep a trend classification cautious even when the underlying indicators point higher.
At the same time, price is closing near the upper Bollinger Band at 149.22. The mid-band sits at 123.85 and the lower band at 98.48. That band width speaks to how wide the recent trading range has become. Sitting this close to the upper band suggests a forceful move. It also raises the question of how much room is left before buyers need a fresh catalyst.
Intraday Context: Momentum Pauses After the Surge
The hourly and 15-minute charts confirm the uptrend is intact but show a short-term pause. This nuance matters because momentum is decelerating right where the daily trend looks strongest.
Hourly Chart: Bullish Regime With a Flattening MACD
On the hourly chart, the bias remains bullish outright. The EMA20 (143.30), EMA50 (137.27) and EMA200 (135.31) are all stacked bullishly, while RSI14 at 60.05 stays healthy rather than overheated. In contrast, the MACD line at 2.71 versus a signal of 2.62 leaves a histogram of just 0.09.
That essentially flat histogram is the key nuance. It signals momentum is decelerating at the point where the daily trend looks strongest. This reads as a classic pause within an otherwise intact uptrend rather than a reversal warning.
15-Minute Chart: Consolidation Takes Hold
The 15-minute timeframe shows that pause playing out in real time. Price at $146.28 is sitting almost exactly on its EMA20 (146.26), with RSI14 at 52.54. That neutral reading reflects short-term consolidation rather than directional conviction.
The MACD histogram has turned negative at -0.52, with the line (0.42) now below the signal (0.94). Price is also trading below the 15m Bollinger mid-band of 147.39. It sits closer to the lower band at 144.84 than the upper one at 149.95. In short, the market is digesting Monday’s gain rather than immediately extending it. That is a normal feature of a strong move, not a red flag on its own.
SpaceX Stock Bullish Scenario: What Would Confirm Continuation
Continuation requires SPCX to clear the daily pivot resistance at R1 (150.83) and hold above the upper Bollinger Band near 149.22. A sustained break there would align with the fundamental backdrop described in recent coverage.
Seeking Alpha has flagged the potential for major ETF and index rebalancing demand as SpaceX’s free float rises following the 13F disclosures. Notably, the newly visible stakes from Google, Nvidia and BlackRock add a layer of institutional credibility. That credibility could attract further inflows.
If the hourly MACD histogram turns positive again, momentum could rebuild. RSI on both daily and hourly charts would also need to push higher without breaching overbought extremes. That combination would support continuation toward the upper end of the daily range.
Bearish Scenario: What Would Invalidate the Uptrend
The bullish setup weakens if SPCX fails to hold the 145.20 daily pivot. A break below the daily S1 at 140.61 would open the door back toward the EMA50/EMA200 cluster between 134.76 and 136.72. That move would effectively undo much of the recent bullish structure.
Meanwhile, a fundamental thread also supports caution. Retail investors sold a net $4.5 million of SPCX on August 7. That was the first day of net selling since the company’s debut, according to Vanda Research data cited by Reuters. The stock had just reclaimed its IPO price, making the shift notable. Combined with news that millions more shares are set to unlock, any renewed supply pressure could weigh on price.
On the intraday side, the first tactical warning would be a break below the 1H support at 145.25. A move under the 15m lower band near 144.84 would signal that the short-term pause is turning into something more.
Overall SpaceX Stock Technical Outlook
Overall, the SpaceX stock setup remains constructive on the daily and hourly timeframes, with trend and momentum indicators broadly aligned to the upside. At the same time, the flat hourly MACD histogram and neutral 15-minute readings show the rally is taking a breather. That pause is worth respecting rather than dismissing.
Given the elevated ATR readings across timeframes, positioning around SPCX should account for outsized swings in either direction. The share structure is still being reshaped by unlocks and shifting retail versus institutional flows. The stock is still a young, post-IPO name finding its footing. Until it clears daily resistance decisively or breaks key support, the near-term path is likely to stay volatile and headline-driven.
FAQ
What is the current technical bias for SpaceX stock?
The daily structure leans bullish. SPCX trades above the EMA20, EMA50 and EMA200, with RSI14 at 58.92 and a positive MACD histogram of 4.30. However, the system still tags the daily regime as neutral because of elevated volatility.
What price levels matter most for SPCX?
Bullish confirmation requires clearing R1 at 150.83 and holding above the upper Bollinger Band near 149.22. On the downside, losing the 145.20 daily pivot and S1 at 140.61 would weaken the bullish setup.
Why did SpaceX stock move higher on Monday?
SPCX surged more than 5% after a 13F filing revealed Google, Nvidia and BlackRock among shareholders. The stock closed at $146.23, near the session high of $149.80.
What is the bearish risk for SPCX?
Retail investors sold a net $4.5 million of SPCX on August 7. That was the first net selling day since the company’s debut, according to Vanda Research data cited by Reuters. News that millions more shares are set to unlock could also add supply pressure.
Disclaimer: This article is for informational purposes only and does not constitute financial advice, an investment recommendation, or a solicitation to buy or sell any financial instrument or cryptocurrency. The analysis provided is not indicative of future results. Investing in crypto assets and financial markets carries a high risk of capital loss. Always do your own research (DYOR) and consult a qualified financial advisor before making any decision.
Article produced with the assistance of artificial intelligence and reviewed by the editorial team.
