



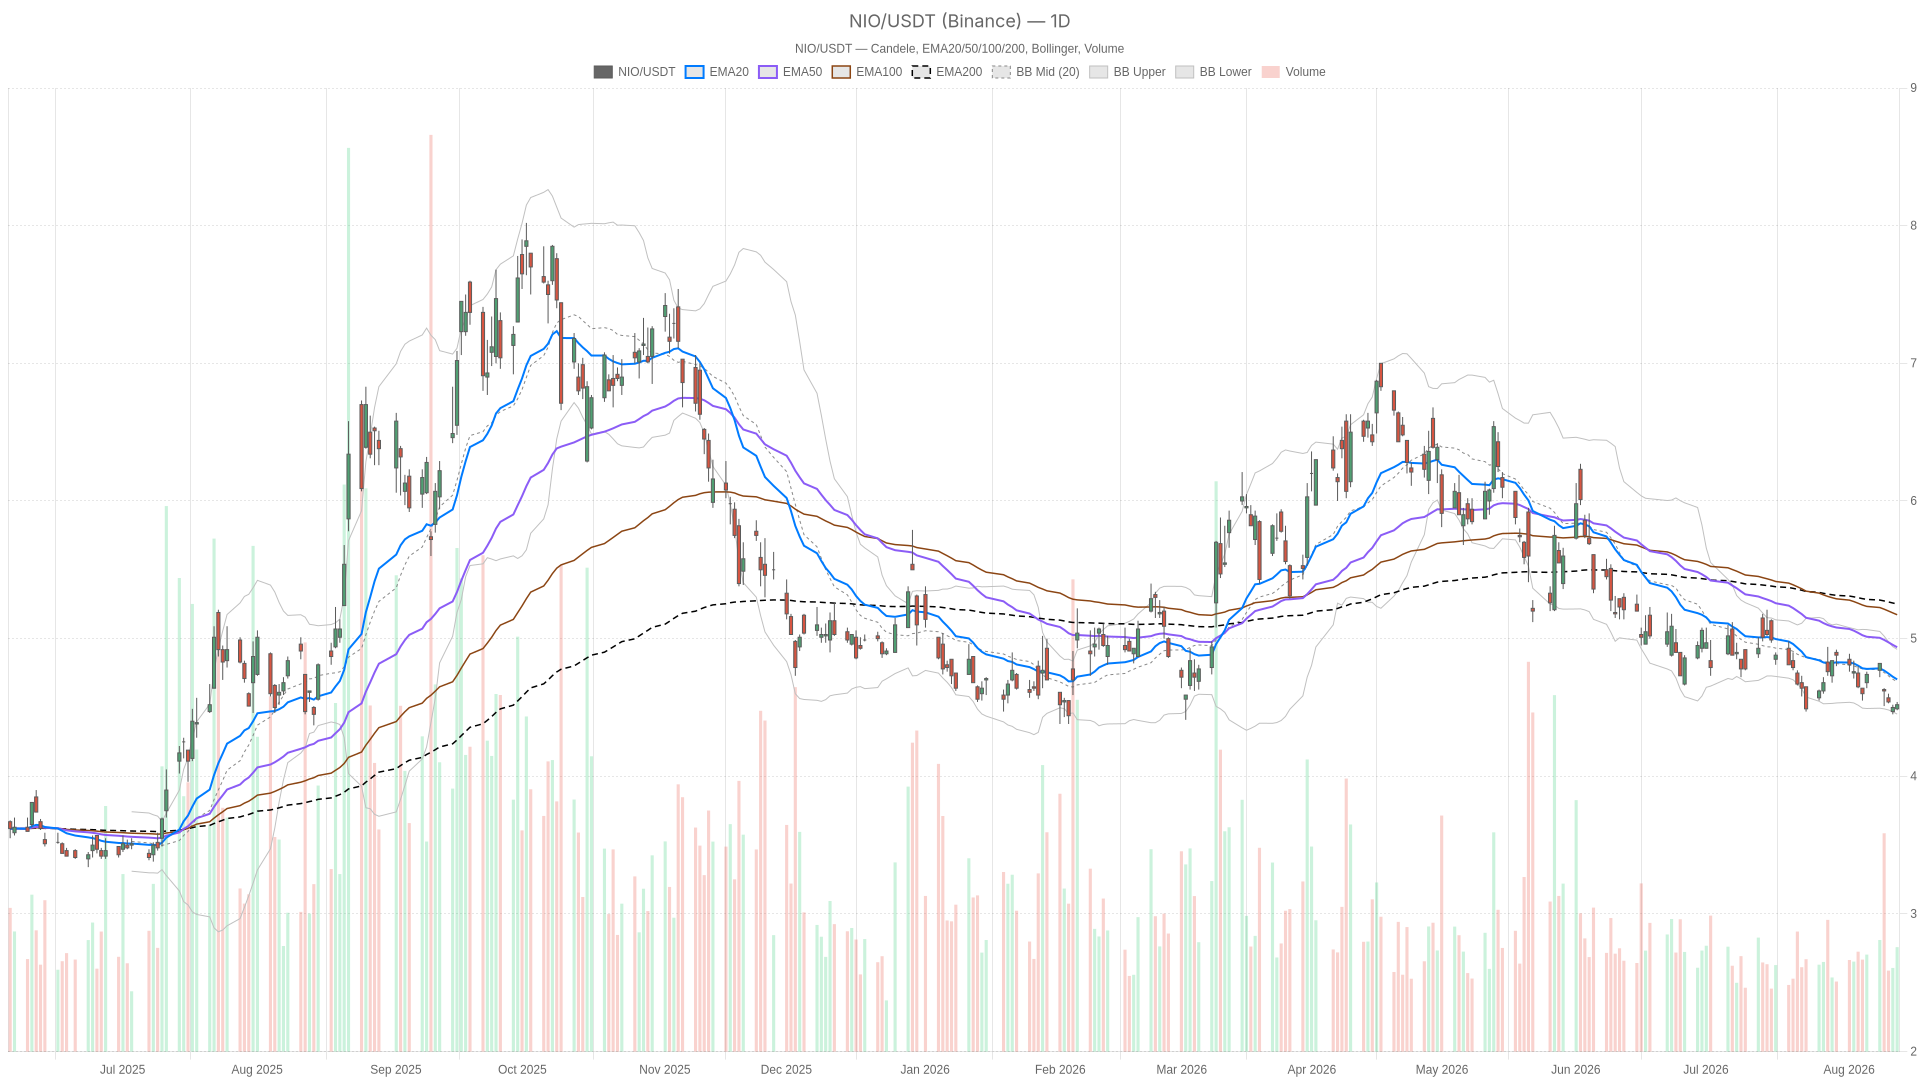
NIO stock stays under pressure on the daily chart, closing at $4.52 on August 14. The broader trend still favors sellers. Momentum has not collapsed further, but it has not turned either. That tension defines the current setup.
Summary
Key takeaways
- NIO stock closed at $4.52 on August 14, trading in a tight $4.48–$4.54 range.
- The daily trend is bearish, with price below the EMA20 (4.70), EMA50 (4.94), and EMA200 (5.25).
- Daily RSI14 reads 39.43, reflecting weak but not yet oversold momentum.
- Institutional flows are mixed: UBS and IMC-Chicago added, while BlackRock and JPMorgan trimmed.
- The 4.49–4.55 pivot zone remains the key near-term battleground.
NIO Stock Daily Structure: Bearish Trend Still in Control
The daily trend for NIO stock remains firmly bearish, with price below all three major moving averages. NIO trades under the EMA20 at 4.70, the EMA50 at 4.94, and the EMA200 at 5.25. This stacked EMA alignment is a textbook downtrend signature. Sellers still dictate the broader path.
The daily RSI14 reads 39.43. That is weak, but not yet oversold. It reflects soft momentum rather than panic selling. Meanwhile, the daily MACD line sits at -0.10 against a signal line of -0.10. The histogram of -0.01 is nearly flat. This suggests bearish momentum is losing force even though the trend has not reversed.
Bollinger Bands on the daily chart show the mid-line at 4.69, the upper band at 4.92, and the lower band at 4.45. Price trades close to the lower band, a zone that often signals stretched downside conditions. The daily ATR14 stands at 0.14, pointing to moderate volatility. Pivot levels place the pivot point at 4.51, R1 at 4.55, and S1 at 4.49. That tight range shows the market is compressed just below the pivot.
Overall, the daily regime is classified as bearish, and the data supports that label. The trend is intact, even if the pace of decline has slowed.
1H Timeframe Confirms the NIO Stock Bearish Bias
The 1-hour chart confirms the bearish bias in NIO stock, with price below all three moving averages. Price at 4.50 remains under the EMA20 (4.53), EMA50 (4.59), and EMA200 (4.75). This confirms the broader bearish structure rather than contradicting it.
However, there is a small divergence worth noting. The 1H MACD histogram has flipped to +0.01. Still, the MACD line (-0.03) sits below the signal line (-0.04). This hints at a short-term stabilization attempt within a still-bearish hourly setup. The 1H RSI14 sits at 41.88, consistent with the daily reading and shy of any bullish reversal signal.
The 1H Bollinger Bands show the mid-line at 4.51, the upper band at 4.57, and the lower band at 4.45. Price hovers right around the mid-line. Pivot levels mirror the daily setup: pivot at 4.51, R1 at 4.53, and S1 at 4.49. Therefore, the 1H timeframe confirms the daily bearish bias. It also shows early, tentative signs that selling pressure may be easing at the margin.
15-Minute Execution Context: Mixed Signals
The 15-minute chart shows neutral momentum in NIO stock, in contrast to the bearish higher timeframes. RSI14 sits almost exactly at the midpoint, 49. The MACD line and signal line both print 0.01, with a flat histogram of 0. Price at 4.50 sits right on top of the EMA20 and EMA50, both at 4.51. The EMA200 sits slightly higher at 4.60.
This is a clear case of mixed signals across timeframes. The 15m regime is still tagged bearish structurally. Yet the momentum readings themselves are essentially flat. Short-term price action is consolidating tightly between the pivot at 4.51 and support at 4.49. There is no clear directional push in either direction. For traders, this compression zone is where near-term execution decisions will likely be made, not where the broader bias gets decided.
NIO Stock Bullish Scenario
A bullish case for NIO stock would require price to reclaim the daily EMA20 near 4.70 with conviction. Ideally, the MACD histogram would keep shrinking toward positive territory across timeframes. A sustained move back above the 1H EMA50 at 4.59 would also help validate a shift away from the bearish regime.
On the news side, Morningstar’s outlook offers some longer-term support. It projects NIO could reach breakeven in 2027 with $348 million in net profit. That comes even as the China EV price war continues to weigh on margins. Notably, renewed institutional buying could provide fundamental tailwinds. UBS rebuilt its stake to $97 million, reversing a sharp Q1 decline. IMC-Chicago also raised its equity position in NIO. These flows could help if price action aligns with that optimism.
NIO Stock Bearish Scenario
The bearish case remains the path of least resistance for NIO stock. A break below the daily support at 4.49, followed by a slide toward the lower Bollinger Band near 4.45, would reinforce seller control. Continued institutional selling would add weight to that scenario.
BlackRock‘s recent 12% stake reduction and JPMorgan’s repeated cuts to its NIO holdings both point to caution among larger holders. Meanwhile, Morningstar warns that cash burn will likely persist for at least a couple more years. Any renewed downside momentum would invalidate hopes of a near-term bullish reversal. That would keep NIO stock pressured. The 200-day EMA near 5.25 serves only as a distant reference, not a near-term target.
Closing Take: NIO Stock Outlook Remains Divided
The overall outlook for NIO stock stays bearish on the daily chart. The 1-hour timeframe confirms that view. Yet momentum shows early signs of leveling off. The 15-minute chart reflects a market pausing in a tight range rather than committing to a direction.
Institutional flows are split. UBS and IMC-Chicago are building positions, while BlackRock and JPMorgan are trimming theirs. Positioning around NIO looks genuinely divided. Volatility, as measured by the ATR readings, remains moderate rather than extreme. The news flow flags the recent “worst run in three weeks.” Morningstar’s cautious long-term profit timeline adds further uncertainty. NIO stock is likely to stay uncertain in the near term. The 4.49–4.55 pivot zone remains the key battleground for direction.
FAQ
Is NIO stock in a bearish trend?
Yes. The daily chart shows NIO below the EMA20 (4.70), EMA50 (4.94), and EMA200 (5.25). The daily regime is classified as bearish.
What are the key support and resistance levels for NIO stock?
Key levels include support at 4.49, the lower Bollinger Band near 4.45, and resistance at 4.55. The 4.49–4.55 pivot zone is the main battleground.
Are institutions buying or selling NIO stock?
Flows are mixed. UBS rebuilt its stake to $97 million and IMC-Chicago raised its position. In contrast, BlackRock cut its stake by 12% and JPMorgan trimmed repeatedly.
When does Morningstar expect NIO to reach breakeven?
Morningstar projects NIO could reach breakeven in 2027, with $348 million in net profit, despite continued pressure from the China EV price war.
Disclaimer: This article is for informational purposes only and does not constitute financial advice, an investment recommendation, or a solicitation to buy or sell any financial instrument or cryptocurrency. The analysis provided is not indicative of future results. Investing in crypto assets and financial markets carries a high risk of capital loss. Always do your own research (DYOR) and consult a qualified financial advisor before making any decision.
Article produced with the assistance of artificial intelligence and reviewed by the editorial team.
