

MSTR stock today trades near $87.23 as Michael Saylor abandons his “never sell Bitcoin” doctrine. The policy shift fundamentally alters the investment thesis. A $2 billion buyback offers short-term support, but the daily chart remains firmly bearish with all moving averages sloping lower.
Summary
Key takeaways
- MSTR stock today trades at $87.23, locked in a structural downtrend below every major daily moving average.
- Daily RSI at 30.4 sits near oversold territory, while MACD momentum remains negative and still expanding to the downside.
- Saylor’s “never sell Bitcoin” policy reversal fundamentally changes how the market prices MSTR’s premium to NAV.
- A $2 billion buyback provides mechanical support near current levels, but structural overhead from the EMA stack is considerable.
- An hourly close above $88.76 is the minimum requirement for bullish confidence; failure below $84.79 targets $80.75.
MSTR Stock Today: Daily Structure Remains Deeply Bearish
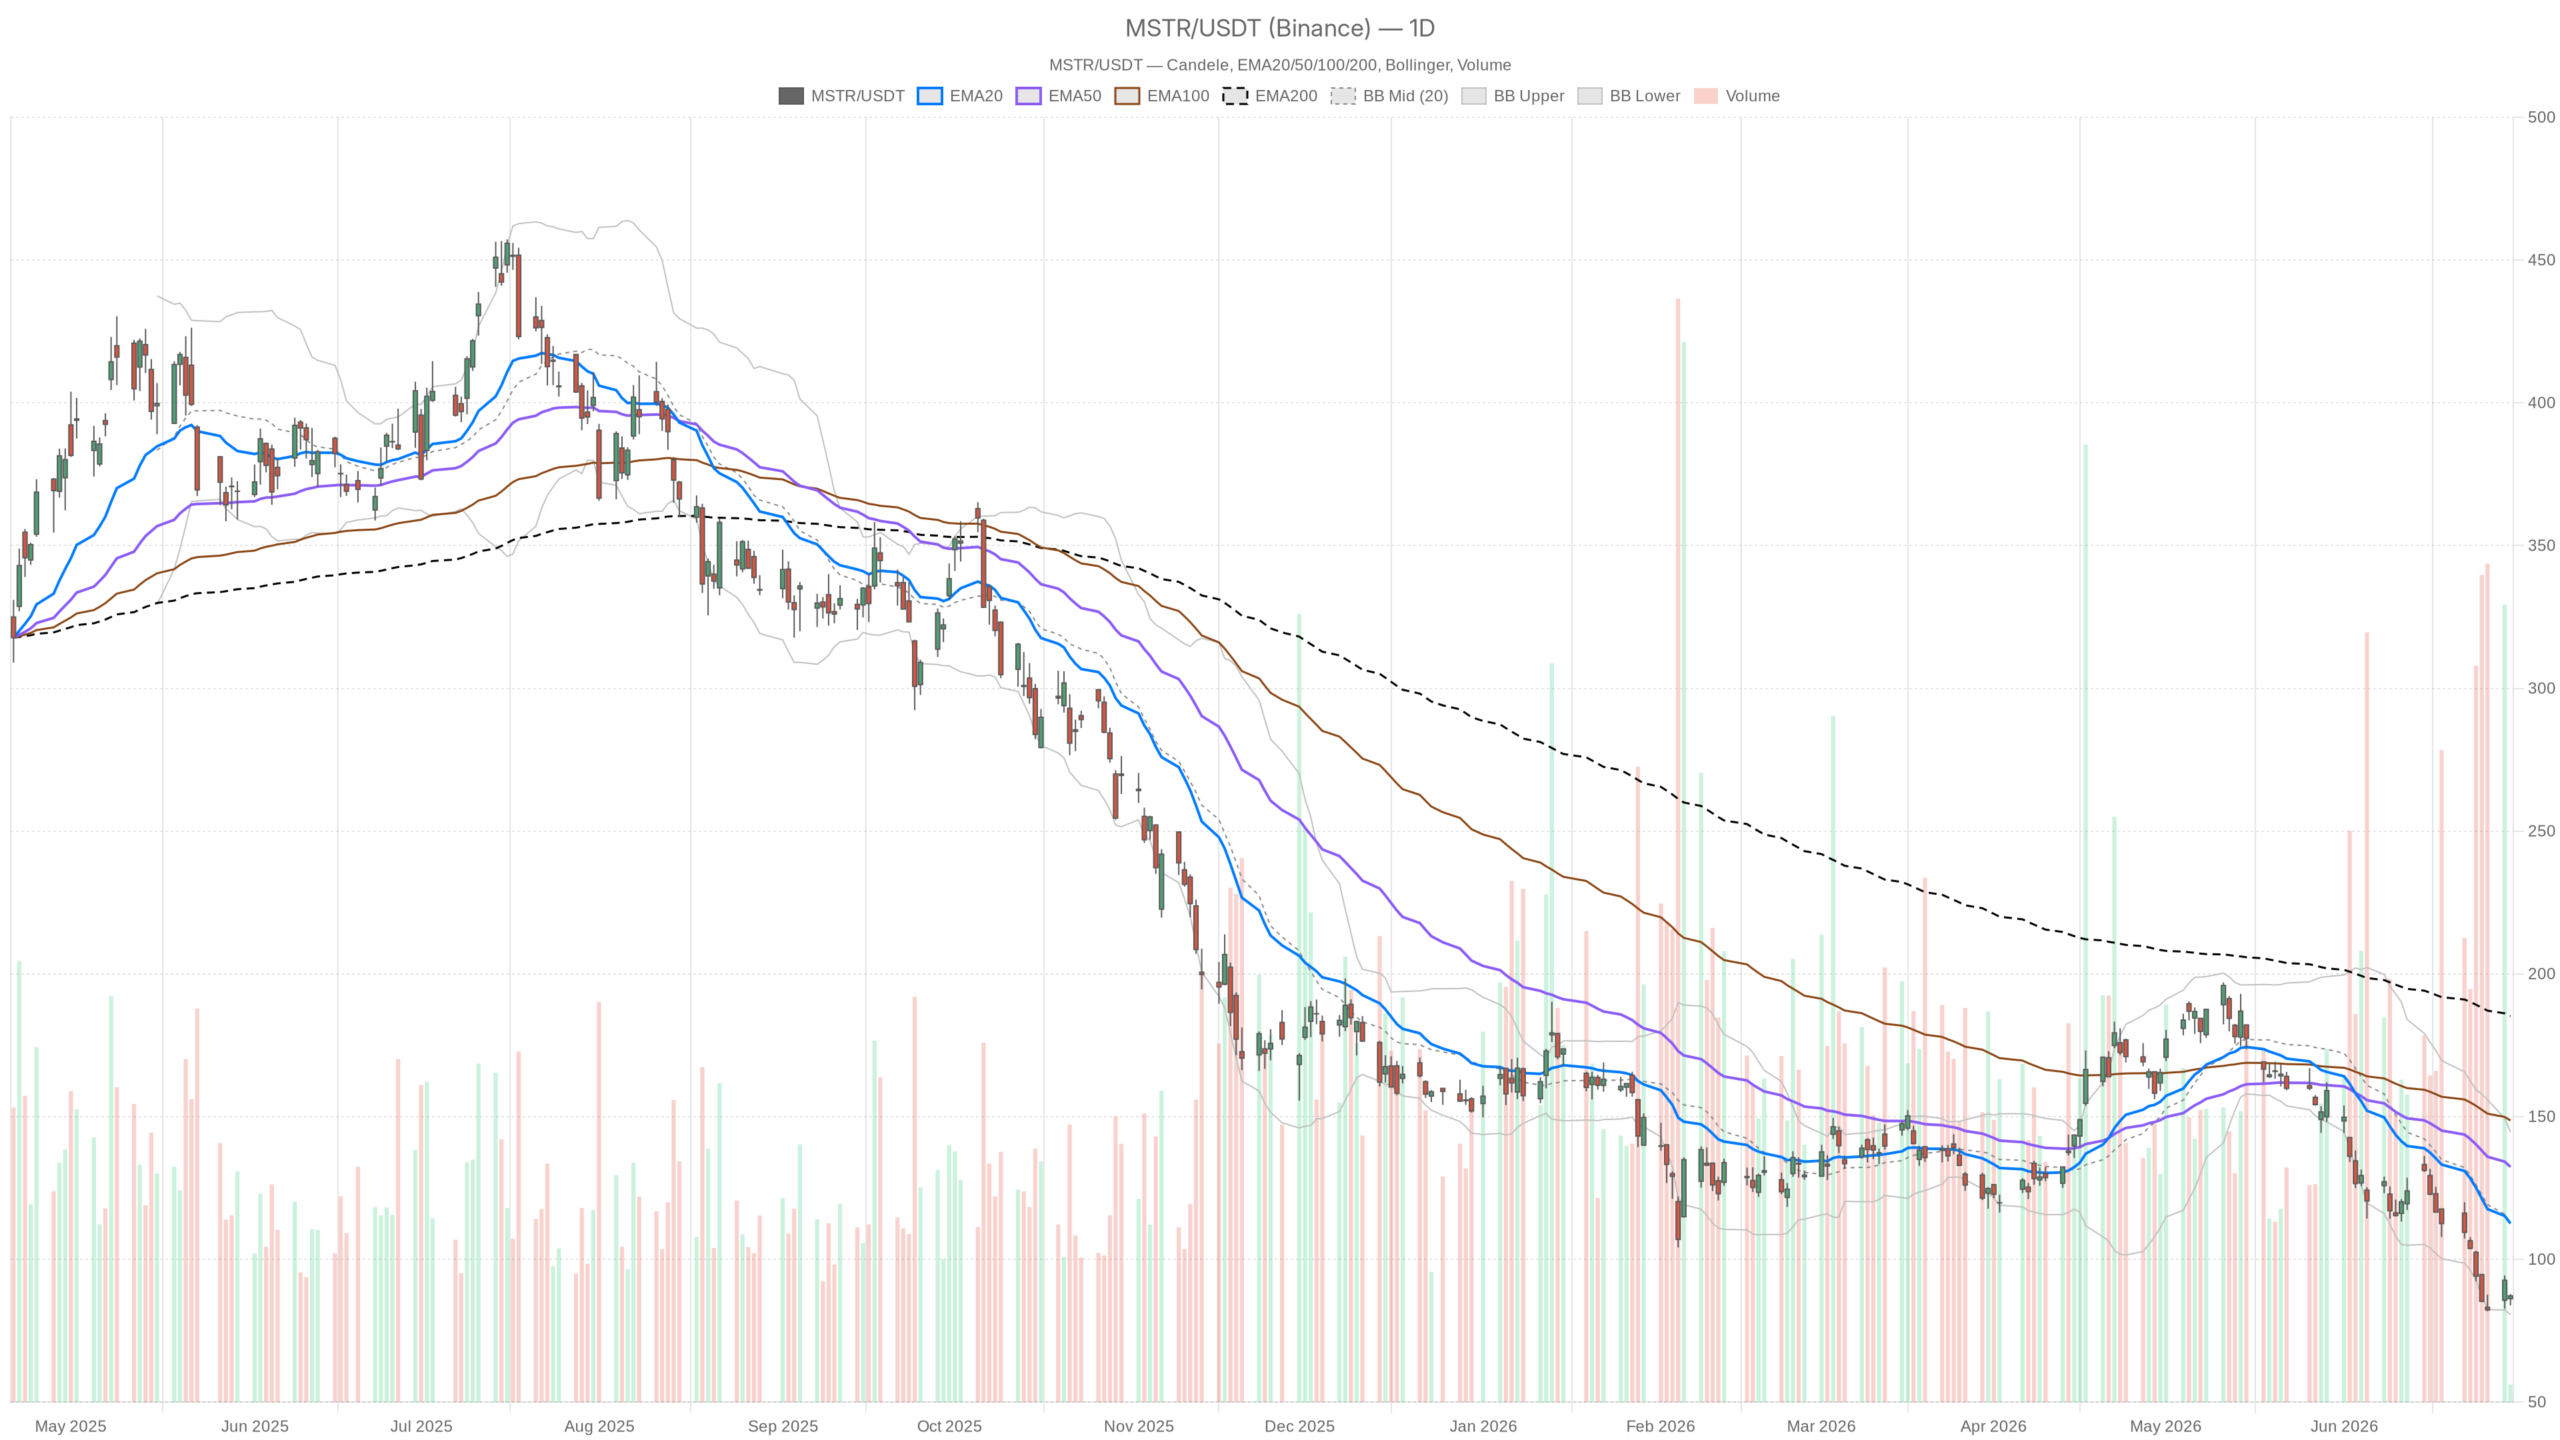
MSTR stock today remains locked in a textbook bearish regime on the daily timeframe. Price trades well below every major moving average, with each sloping lower in a cascading bearish stack.
The EMA20 sits at $112.56, the EMA50 at $132.39, and the EMA200 at $185.18. The stock has effectively been cut in half relative to its longer-term trend. This configuration defines a structurally bearish regime with no ambiguity. There is simply no bullish argument on the daily chart at current levels.
Meanwhile, the daily RSI at 30.4 places MSTR right at the edge of oversold territory. However, oversold conditions in a sustained downtrend frequently persist longer than traders expect. The MACD reinforces this negative view.
It reads -16.7 against a signal of -14.59, producing a negative histogram of -2.11. Momentum is negative and still expanding to the downside on the daily timeframe. No bullish crossover is in sight.
Bollinger Band positioning adds further context. The daily lower band sits at $80.75, with price currently near $87.23. The midline at $112.71 represents the first meaningful mean-reversion target, sitting nearly 30% above current price.
The daily ATR of $9.44 signals significant range and elevated volatility risk in both directions. Position sizing matters here more than almost anywhere else.
How the End of “Never Sell Bitcoin” Reshapes MSTR’s Valuation
Saylor’s decision to monetize BTC holdings removes a core pillar of the MSTR investment thesis. It structurally alters how the market should price the stock’s Bitcoin premium going forward.
With Bitcoin sliding below $60,000 and MSTR’s market-to-NAV ratio dipping under 1x, the company confirmed it may sell portions of its BTC holdings. The proceeds would service debt, fund dividends, and maintain operational reserves. This is not a minor operational tweak.
The “never sell Bitcoin” doctrine had been central to the MSTR narrative for years. Investors paid a premium for leveraged BTC exposure managed by a committed HODLer. That premium is now structurally different, and the market is still digesting what the shift means for long-term valuation.
In contrast, the company also announced a $2 billion stock buyback program alongside a new digital credit capital framework. Buybacks at current levels, well below NAV, are arithmetically accretive if executed aggressively.
However, the policy reversal’s negative implications may outweigh the buyback’s mechanical support. The confirmed willingness to sell BTC creates an overhang. The market will discount that potential selling pressure into the stock price in real time.
Short-Term Momentum Shows Stabilization, Not Reversal
The hourly chart offers faint signals of stabilization, but no genuine reversal is confirmed. The H1 EMA stack remains fully bearish with price below all three key averages.
Notably, the H1 MACD histogram has turned positive at +1.46. The MACD line remains negative at -1.85. That histogram flip signals easing short-term selling pressure, though the move lacks conviction.
Meanwhile, the H1 RSI at 40.55 sits in neutral territory. It points to stabilization rather than a genuine reversal. Price trades below the 20, 50, and 200-period EMAs at $89.89, $97.26, and $124.30 respectively.
This combination defines a potential dead-cat bounce. The term appeared explicitly in analyst commentary today. Optimism around the new capital allocation framework may be fueling the short-term recovery. Still, the structural weight overhead is considerable.
On the 15-minute chart, regime classification flips to neutral. That is the only timeframe where the neutral label applies. The 15m MACD line is nearly flat at -0.01. However, the histogram has turned slightly negative at -0.98, suggesting the very near-term bid is fading. The RSI at 43.73 is directionless.
Key Pivot Levels Defining Intraday Risk for MSTR
MSTR stock today trades near the daily pivot at $86.31. Resistance sits at R1 $88.76, while support is defined at S1 $84.79. These levels define the immediate intraday range.
With MSTR currently at $87.23, the stock is trading in the middle of that range. A clean hold above $88.76 on an hourly close is the minimum requirement for bulls to build intraday confidence. Failure back through $84.79 would quickly bring the Bollinger lower band at $80.75 back into focus.
The pivot point across both daily and hourly calculations aligns near $86.31. That reinforces its technical significance. Traders should treat this level as the near-term line in the sand.
Bullish and Bearish Scenarios for MSTR Stock Today
The bullish case for MSTR stock today requires Bitcoin stabilization above $60,000 and aggressive buyback execution. The bearish scenario accelerates if BTC breaks to new lows and balance sheet stress intensifies.
Bullish scenario
A recovery in Bitcoin would reduce selling pressure on MSTR’s implied NAV. The $2 billion buyback, if aggressively deployed, could create a mechanical bid under the stock near current levels. The H1 MACD histogram recovery, if sustained, could build into a broader hourly trend reversal. In that scenario, a move toward the daily Bollinger midline near $112 becomes a plausible medium-term target. However, that remains a multi-week recovery story at minimum.
Bearish scenario
In contrast, the bearish scenario invalidates that hope quickly. If Bitcoin resumes its decline, the company’s confirmed willingness to sell BTC creates an immediate overhang. The daily MACD still has room to deteriorate further. RSI readings near 30 are not floor guarantees in bear markets. A close below $84.79 would likely accelerate selling toward the $80 Bollinger support. Below that level, limited technical structure exists to slow the decline.
Overall, MSTR stock today sits at a genuine inflection point. It is shaped equally by technical exhaustion and a fundamental regime change. The daily timeframe leaves no room for bullish assumptions. The hourly offers a faint signal of stabilization, and the 15-minute is simply choppy.
Volatility, as measured by the daily ATR near $9.44, is high enough to make short-term moves look meaningful when they may not be. Until price reclaims the EMA20 near $112 on the daily, any rally should be treated as relief within a downtrend. It is not evidence of structural recovery.
FAQ
What is MSTR stock trading at today?
MSTR stock today trades at approximately $87.23 as of June 30, 2025. The stock remains in a deep structural downtrend, trading well below its EMA20 at $112.56, EMA50 at $132.39, and EMA200 at $185.18.
Why did MSTR stock drop sharply?
The sharp decline reflects two converging pressures. First, Bitcoin slid below $60,000, directly compressing MSTR’s implied net asset value. Second, Michael Saylor abandoned his “never sell Bitcoin” policy, fundamentally altering the investment thesis and removing a key premium the market had assigned to the stock.
What is the significance of Saylor ending the “never sell Bitcoin” policy?
This policy reversal is structurally significant. It confirms the company may monetize BTC holdings to service debt, fund dividends, and maintain reserves. Investors can no longer price MSTR as a pure leveraged HODL vehicle, which changes how the stock’s premium to NAV should be calculated.
What key levels should traders watch for MSTR stock?
The critical levels are the daily pivot at $86.31, resistance at R1 $88.76, and support at S1 $84.79. An hourly close above $88.76 is the minimum requirement for bullish confidence. A failure below $84.79 targets the Bollinger lower band at $80.75. The daily Bollinger midline at $112.71 represents the first meaningful mean-reversion target on the upside.
Disclaimer: This article is for informational purposes only and does not constitute financial advice, an investment recommendation, or a solicitation to buy or sell any financial instrument or cryptocurrency. The analysis provided is not indicative of future results. Investing in crypto assets and financial markets carries a high risk of capital loss. Always do your own research (DYOR) and consult a qualified financial advisor before making any decision.
Article produced with the assistance of artificial intelligence and reviewed by the editorial team.