




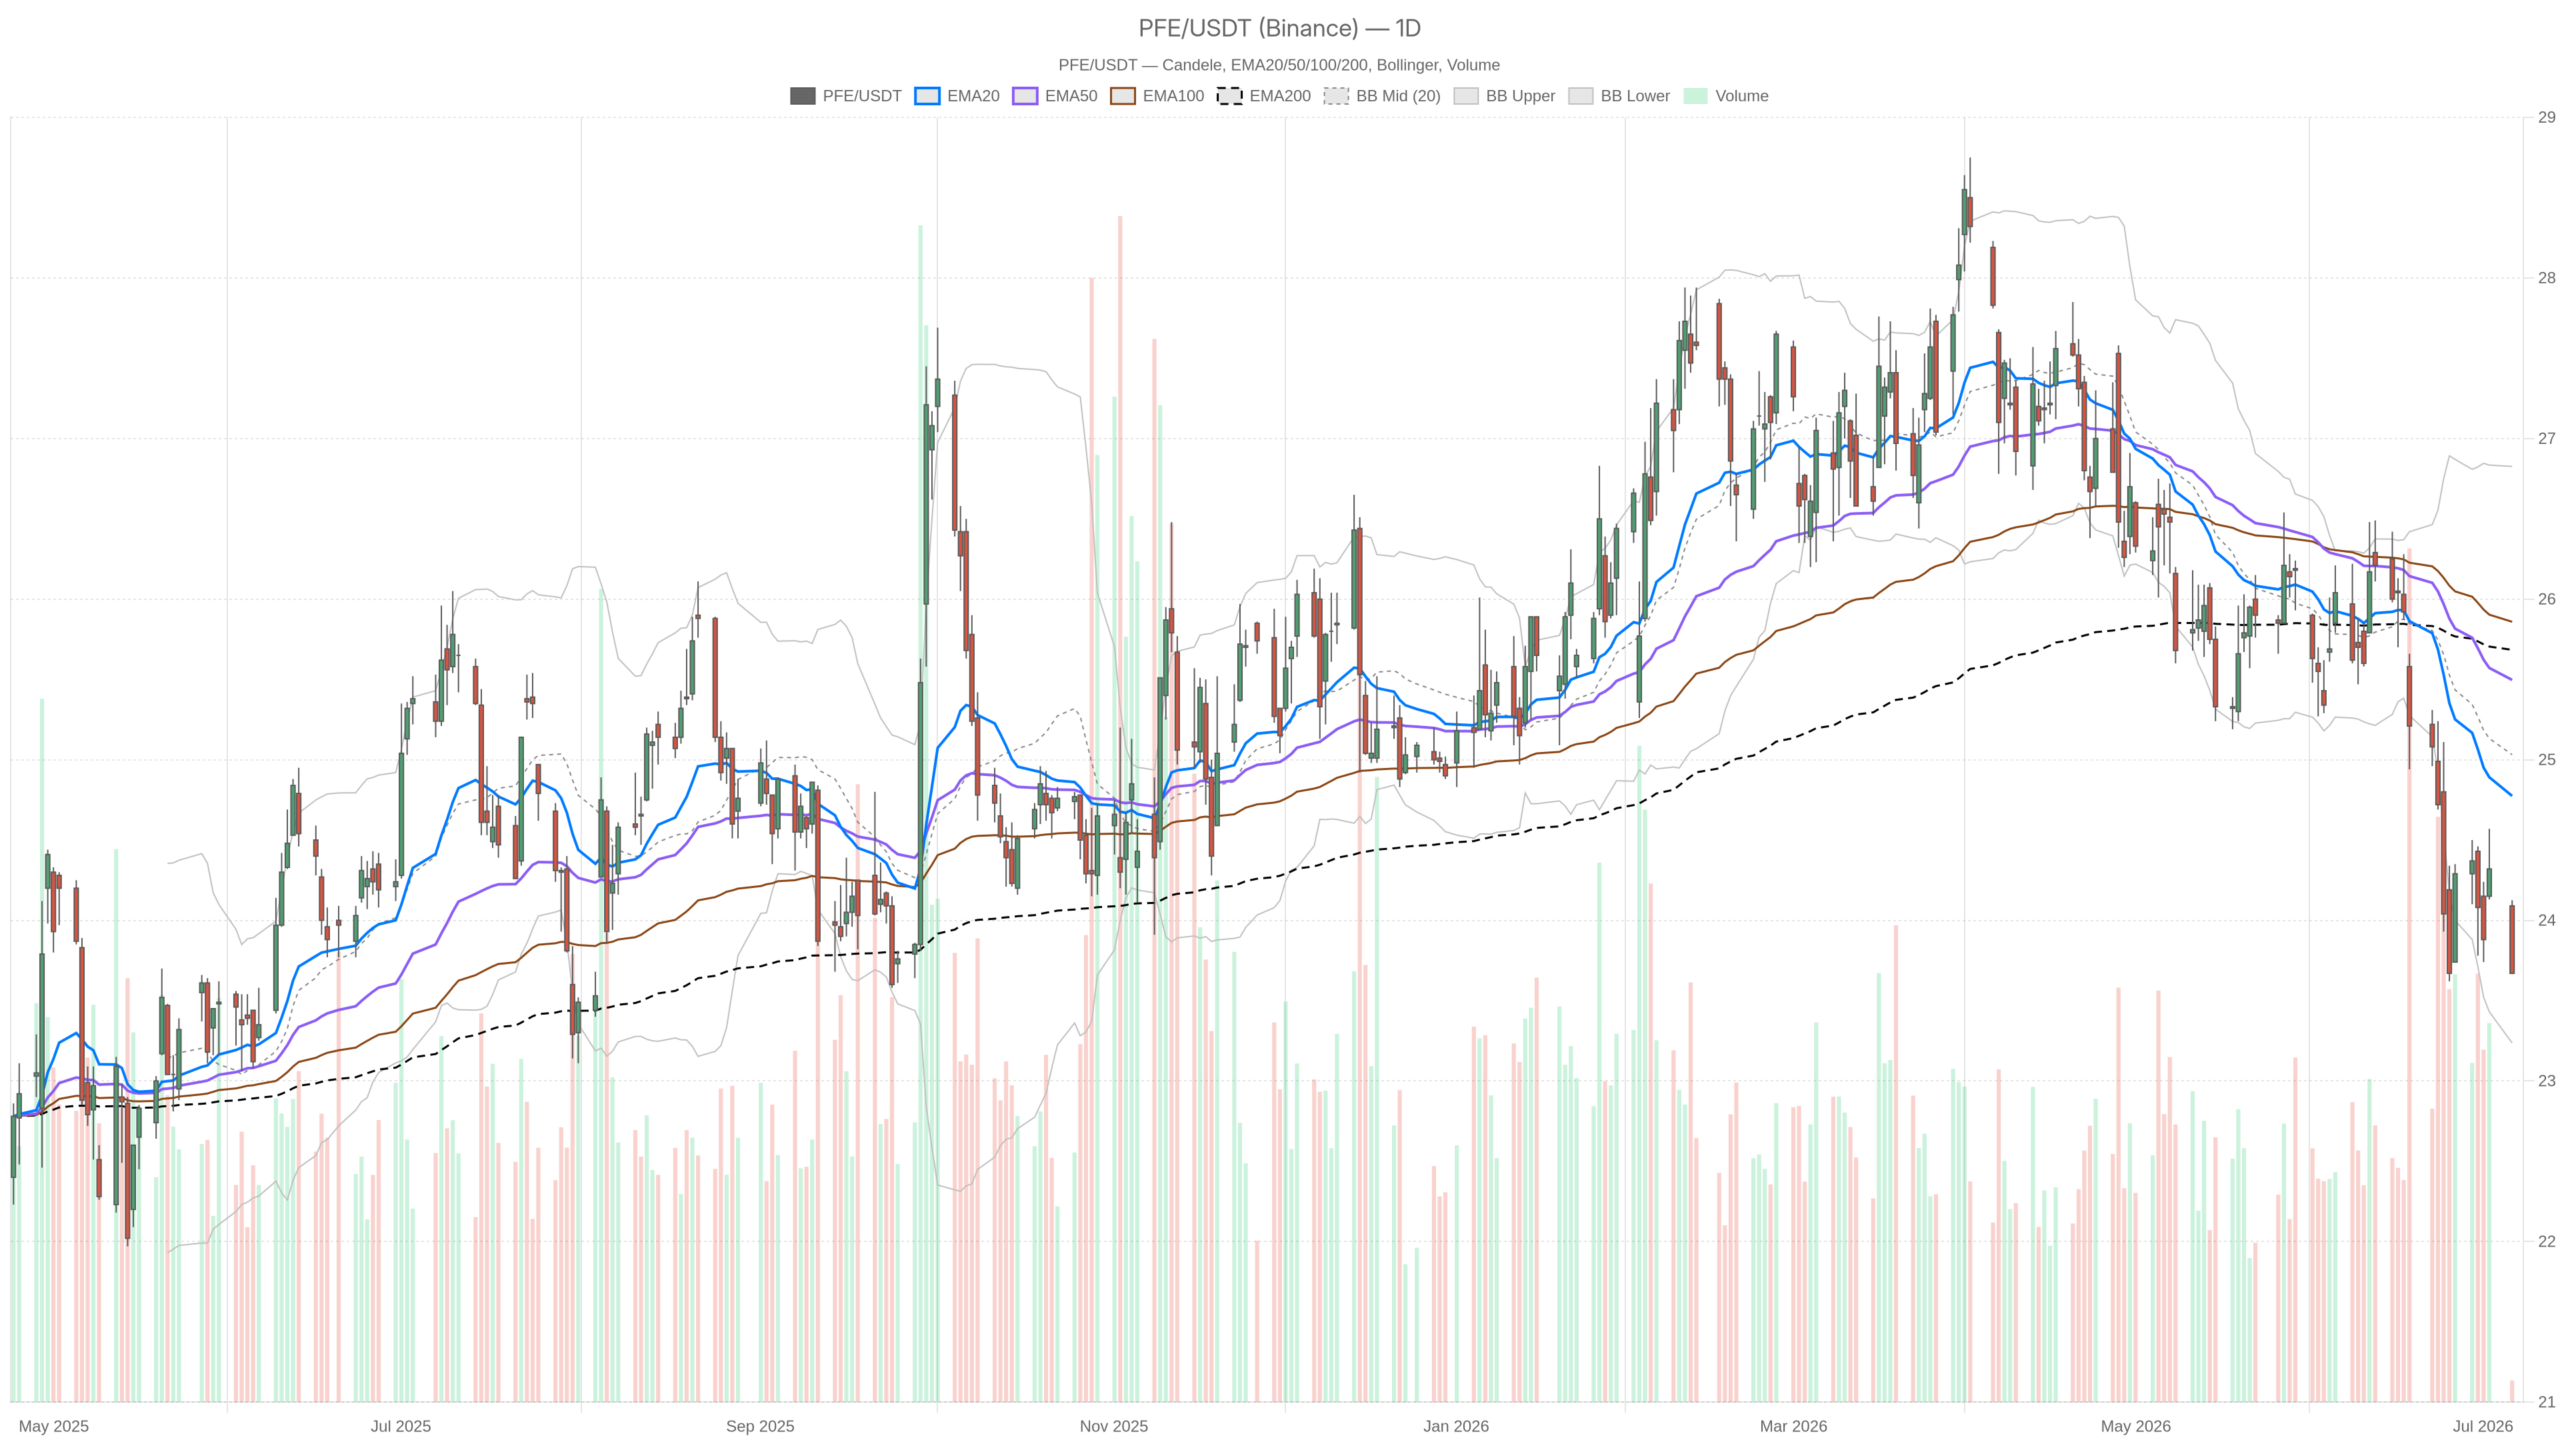
PFE stock remains under heavy selling pressure at $23.67, trading below all major daily moving averages. A fresh HSBC downgrade compounds the bearish technical picture. Momentum indicators across all timeframes confirm sellers are in full control of Pfizer shares.
Summary
Key takeaways
- PFE stock trades at $23.67 as of July 6, situated below the 20-day, 50-day, and 200-day EMAs in a tightly stacked bearish alignment.
- Daily RSI at 34.03 approaches oversold territory but shows no bullish divergence to support a reversal case.
- Daily MACD remains negative at -0.55 with a widening histogram, signaling active rather than fading selling pressure.
- HSBC’s recent downgrade citing a lack of near-term catalysts reinforces the bearish technical structure for Pfizer.
- The $23.52 daily S1 level serves as the immediate line in the sand — a break below opens the door to further downside toward $23.24.
PFE Stock Daily Chart Shows Deepening Bearish Structure
PFE stock’s daily chart reveals a structurally bearish configuration with no immediate signs of reversal. The 20-day EMA sits at $24.77, the 50-day at $25.50, and the 200-day at $25.68. Price is trading beneath all three in a tightly stacked bearish alignment. That configuration reflects a market where sellers have controlled price for an extended period. This is not a brief dip but a sustained downward drift.
The daily RSI at 34.03 is approaching oversold territory but has not yet reached it. An RSI hovering just above 30 can indicate exhaustion. However, it can also signal persistent bearish momentum with no imminent floor. There is no bullish divergence visible at this stage to argue for a reversal.
Meanwhile, the daily MACD is negative at -0.55 versus a signal of -0.45. The histogram is printing -0.11. The spread between line and signal is still widening. This confirms the downward move remains active rather than fading.
Bollinger Bands on the daily frame place the midline at $25.03 and the lower band at $23.24. Price is pressing toward the lower band, reflecting elevated selling pressure. However, proximity to the lower band alone is not a reversal trigger. It simply confirms the stock is in a stretched bearish phase. Mean reversion has not yet begun to stabilize the move.
Daily ATR sits at $0.62, which is moderate. It suggests intraday moves are not explosive but meaningful enough to make short-term positioning consequential. The daily pivot point is at $23.82, with R1 at $23.98 and S1 at $23.52. Price closed at $23.67 — below the pivot and dangerously close to S1. A break and close below $23.52 would extend the bearish structure. Minimal nearby support is visible on the chart.
Short-Term Timeframes Reinforce Selling Pressure on PFE Stock
The hourly and 15-minute charts confirm the bearish bias seen on PFE stock’s daily frame. However, short-term momentum has momentarily stalled rather than accelerated. This adds a nuanced layer to the execution picture without changing the dominant trend.
1-Hour Chart: Downtrend Intact Despite Stalling Momentum
The 1H MACD line and signal are both sitting at -0.02, with the histogram at zero — essentially flat. That is not a bullish signal. It does indicate the short-term selling impulse has momentarily stalled. The decline is not accelerating further. The 1H RSI at 36.17 is also weak but not yet at an extreme.
In contrast, the 1H EMA stack mirrors the daily. Price remains below the 20, 50, and 200 EMAs at $24.12, $24.29, and $25.13 respectively. The bearish trend is intact on the hourly frame. The pace of decline has briefly moderated, but the structure has not changed.
15-Minute Chart: Oversold but Not Reversing
Zooming into the 15-minute chart, the signal becomes more acute. The 15m RSI has dropped to 25.06 — firmly in oversold territory. The MACD histogram is -0.08, showing fresh momentum to the downside in the short session. Price is hugging the lower Bollinger Band on this timeframe. The band sits at $23.72, and price at $23.67 has already broken through.
The 15m regime is classified as bearish. The tight pivot range, with R1 at $23.71 and S1 at $23.65, suggests the market is coiling in a very narrow zone near recent lows. Notably, the short-term oversold reading is worth watching. It does not confirm a reversal, but it could act as a pause trigger. Short-term traders may see a technical bounce from this compressed zone. Still, such a move would need to reclaim the $23.82 pivot on the hourly. Only then could it be considered anything more than noise within a larger downtrend.
Fundamental Headwinds Compound PFE Stock’s Technical Weakness
Fundamental developments are adding weight to PFE stock’s technical weakness. HSBC’s downgrade, citing a lack of near-term catalysts, aligns directly with what the charts are showing. At the same time, the FDA approval of Ibrance in combination with trastuzumab for HR-positive, HER2-positive patients is a genuine pipeline milestone. Hedge funds have noted this in arguing for PFE as a top dividend play.
Pfizer’s CEO has also signaled intent for acquisitions, referencing the company’s substantial balance sheet capacity. These are medium-term positives. However, they exist in tension with the immediate technical reality. Overall, the fundamental picture is mixed but leaning negative in the near term.
Bullish Scenario for PFE Stock Requires Multiple Alignments
A bullish reversal in PFE stock would require several conditions to align before becoming credible. A sustained hold above the $23.52 support level is the minimum requirement. Beyond that, reclaiming the $23.82 pivot and then clearing $23.98 resistance on the hourly would be meaningful early signals. A broader recovery toward $24.77 — the daily 20 EMA — would represent the first real test of the downtrend. Fundamental catalysts would also be needed. An acquisition announcement, positive earnings revision, or renewed institutional buying would need to accompany any technical recovery.
Bearish Case Remains the Default for PFE Stock
The bearish case for PFE stock is currently better supported by both structure and sentiment. A break below $23.52 daily S1 would likely accelerate the decline toward the lower Bollinger Band at $23.24 and potentially below. The absence of any MACD bullish crossover on the daily remains a significant headwind. Combined with price trapped under all major EMAs, the burden of proof sits firmly with the bulls. HSBC’s downgrade removes a near-term institutional buying trigger. That trigger might otherwise have helped stabilize the shares.
Overall, Pfizer stock is navigating a difficult stretch. Technical structure, analyst sentiment, and short-term price action are all pointing in the same direction. The daily regime is unambiguously bearish. The hourly confirms it without exception. The 15-minute frame is showing oversold exhaustion but within a downtrend. Until daily momentum indicators stabilize and price recovers above the pivot cluster, the path of least resistance for PFE stock remains lower.
FAQ
What is the current trend for PFE stock?
PFE stock is in a clear downtrend across all major timeframes. Price at $23.67 sits below the 20-day EMA ($24.77), 50-day EMA ($25.50), and 200-day EMA ($25.68). The daily RSI at 34.03 and negative MACD confirm persistent selling pressure with no reversal signals yet.
What are the key support and resistance levels for PFE stock?
The immediate support is the daily S1 pivot at $23.52. A break below this level would open the door to the lower Bollinger Band at $23.24. On the upside, the $23.82 daily pivot and $23.98 R1 serve as the first resistance levels to watch for any recovery attempt. The daily 20 EMA at $24.77 marks a more significant resistance test.
What fundamental factors are affecting PFE stock right now?
HSBC recently downgraded PFE stock, citing a lack of near-term catalysts. However, the FDA approval of Ibrance in combination with trastuzumab represents a positive pipeline development. Pfizer’s CEO has also signaled potential acquisitions using the company’s substantial balance sheet capacity, offering medium-term upside potential.
Is PFE stock oversold and due for a bounce?
The 15-minute RSI at 25.06 is firmly oversold, which could trigger a short-term technical bounce. However, the daily RSI at 34.03 has not yet reached oversold territory. Any bounce would need to reclaim the $23.82 hourly pivot before being considered more than noise within the larger downtrend.
Disclaimer: This article is for informational purposes only and does not constitute financial advice, an investment recommendation, or a solicitation to buy or sell any financial instrument or cryptocurrency. The analysis provided is not indicative of future results. Investing in crypto assets and financial markets carries a high risk of capital loss. Always do your own research (DYOR) and consult a qualified financial advisor before making any decision.
Article produced with the assistance of artificial intelligence and reviewed by the editorial team.
