




Summary
Strategy Stock Faces a Defining Moment Under Structural Pressure
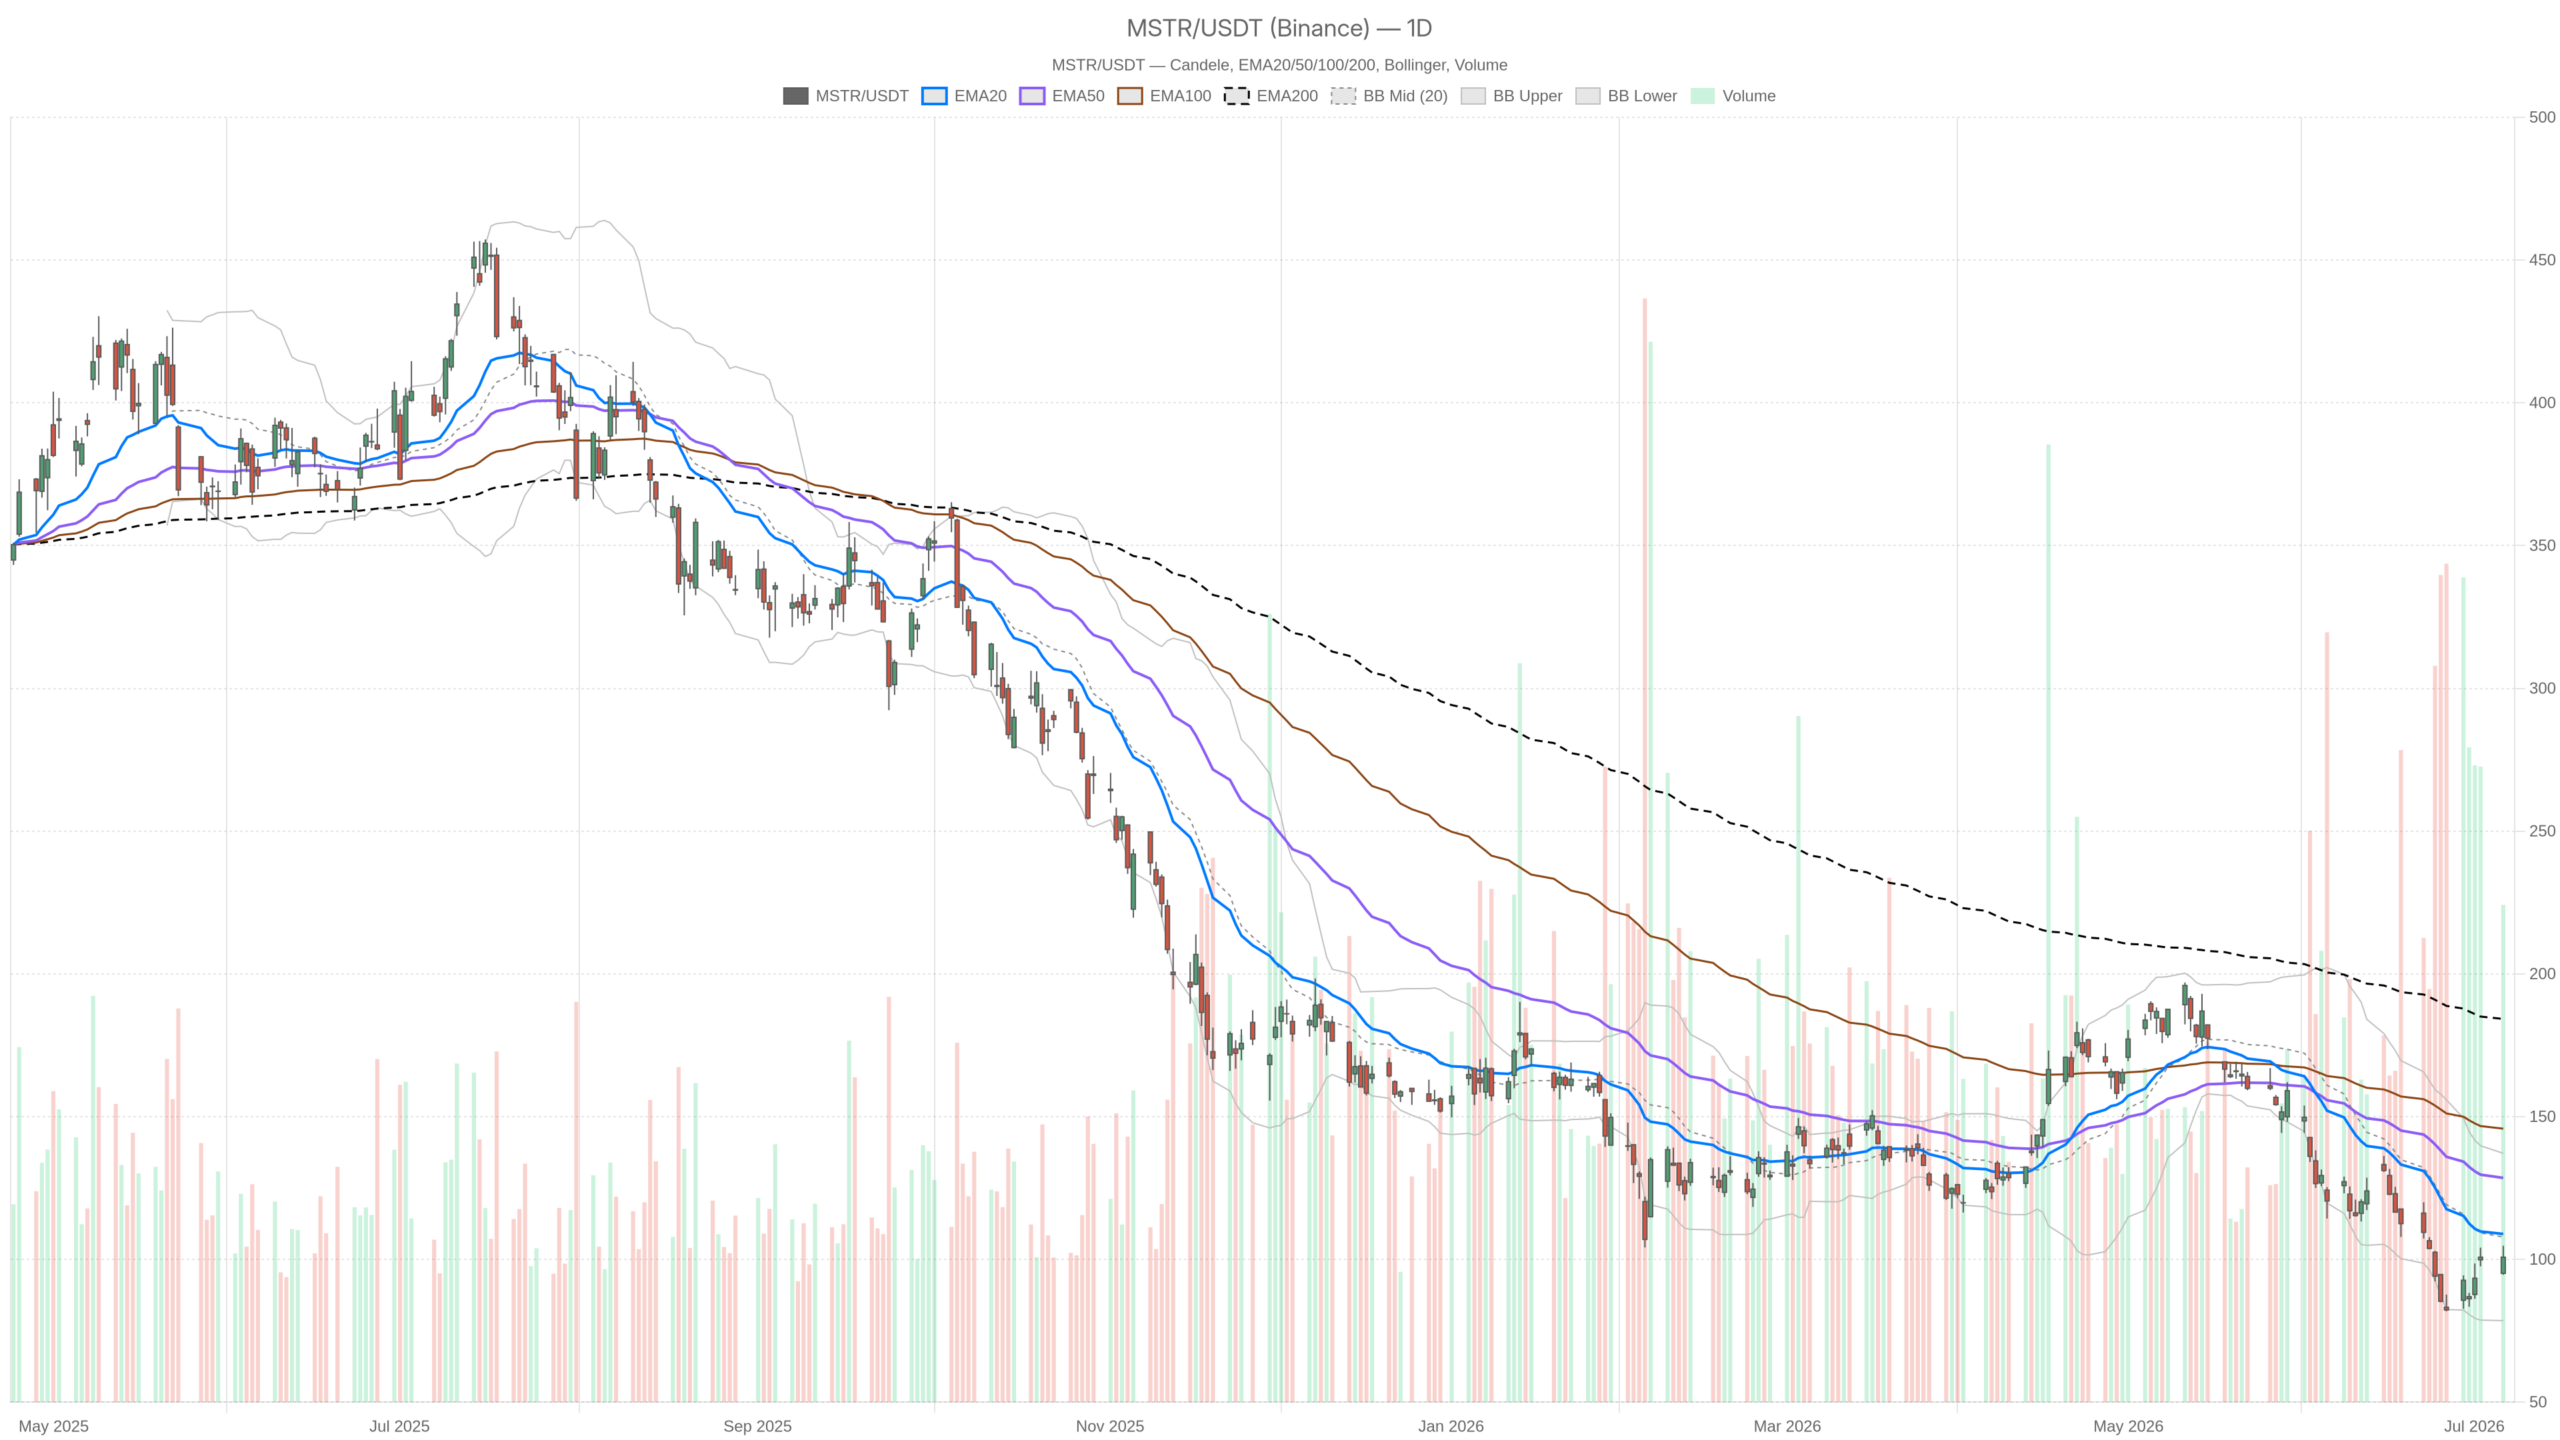
Strategy Stock (MSTR) faces a structurally bearish outlook as technical weakness and fundamental pressures converge. Price closed at $100.77 on July 6, below every major moving average. An $8.32 billion quarterly loss and a $216 million Bitcoin sale reinforce the bearish thesis. MSTR remains under clear distribution until price reclaims overhead resistance.
Key takeaways
- MSTR closed at $100.77 on July 6, trading below all daily moving averages — EMA20 at $108.91, EMA50 at $128.54, and EMA200 at $184.21.
- Strategy reported an $8.32 billion quarterly loss on digital asset holdings and sold approximately 3,588 BTC for $216 million between June 29 and July 5.
- The daily RSI14 at 40.62 has room to fall further — it has not yet reached oversold territory.
- A break below S1 at $95.34 would open a direct path toward the lower Bollinger band near $78.54.
- The mNAV valuation metric faces scrutiny over its use of face value rather than market value for debt and preferred stock.
Daily Timeframe: The Bear Case Is Firmly Established
On the daily chart, the regime is unambiguously bearish. Price sits beneath the EMA20 at $108.91, the EMA50 at $128.54, and the EMA200 at $184.21. That descending staircase signals sustained distribution, not a temporary pullback. No credible momentum argument exists for bulls while price trades this far below all three trend anchors.
Momentum Indicators Confirm Downside Pressure
Meanwhile, the RSI14 at 40.62 adds weight to the bearish read. It has not crossed into oversold territory. That means there is room to fall further without a mechanical bounce being triggered. The MACD line sits at -13.85 against a signal of -14.70. The histogram has turned slightly positive at 0.86 — a marginal green shoot. However, it is far too early to call this a trend reversal. At best, it suggests the rate of decline is slowing modestly.
Volatility Context and Range Analysis
Bollinger Bands frame the broader range between $78.54 on the lower band and $137.14 on the upper. The midline sits at $107.84, above current price. That confirms the stock is trading in the lower half of its recent range. The ATR14 at 10.05 underscores that this is a high-volatility instrument. Daily swings of $10 are entirely normal. This demands careful position sizing from anyone engaging the name.
Pivot Analysis Defines Key Levels
Pivot analysis reinforces the pressure. The daily pivot point stands at $100.06, with R1 at $105.49 and S1 at $95.34. Price closed fractionally above the pivot, offering a thin technical buffer. However, a close beneath $95.34 would open a more direct path toward the lower Bollinger band near $78.54.
Fundamental Catalysts Are Compounding Strategy Stock’s Weakness
Fundamental pressures are compounding the technical deterioration in Strategy Stock. The company revealed an $8.32 billion loss on its digital asset holdings for the quarter ended June 30, 2026. That is an extraordinary figure. On top of that, the company sold approximately 3,588 BTC for $216 million between June 29 and July 5. Proceeds were earmarked for distributions on its preferred stock STRC. This marks a significant strategic shift. Strategy built its identity on aggressive Bitcoin accumulation. Selling BTC to fund preferred distributions is a different posture entirely.
mNAV Methodology Under Scrutiny
One headline from Seeking Alpha raises an additional concern. The WSJ reportedly flagged that Strategy’s mNAV metric uses face value rather than market value for its debt and preferred stock. If accurate, that would overstate the Bitcoin premium at which MSTR trades. It undermines one of the core valuation arguments used by bulls. This is not a minor accounting nuance — it strikes at the heart of how the market prices this stock relative to its Bitcoin holdings.
Leverage and Financing Costs Erode the Accumulation Model
Furthermore, a Yahoo Finance report notes that higher financing costs, growing leverage, and the rise of preferred instruments are eroding the original Bitcoin accumulation playbook. With 17% of Bitcoin sale capacity already deployed, the model is under visible strain. These are not abstract risks. They are active pressures showing up in both earnings and capital allocation decisions.
Hourly View: A Pocket of Relative Strength Within a Weak Trend
The 1-hour timeframe offers a partial counterpoint, but not enough to challenge the daily bias. The H1 regime is classified as neutral. Price at $100.84 sits above both the H1 EMA20 at $98.83 and the EMA50 at $97.61. That is constructive on a short-term basis. The H1 RSI14 at 57.94 leans modestly bullish, showing that intraday momentum has recovered from lower levels.
However, the H1 MACD is essentially flat. The line at 2.45 sits against the signal at 2.44 with a histogram of just 0.01. That near-zero reading suggests the intraday bounce has stalled. It is not rolling over aggressively, but it lacks conviction. In contrast to the daily picture, this is less a bullish signal and more a temporary equilibrium.
On the hourly, price sits comfortably within the Bollinger Band range of $94.54 to $104.37, near the midpoint. The pivot structure shows PP at $101.17, R1 at $101.61, and S1 at $100.40. Price is oscillating in an extremely tight band around the pivot — a textbook sign of indecision at a key level. Notably, the H1 EMA200 at $118.70 remains a distant ceiling, confirming the macro trend is still down.
15-Minute Frame: Execution Context Shows Fading Momentum
At the 15-minute level, the picture shifts slightly more cautious. The MACD histogram has turned negative at -0.15, with the line at 0.27 crossing below the signal at 0.43. That is a micro bearish cross. The RSI14 at 49.10 is effectively neutral. Together, these signals indicate that the short-term bounce seen in the hourly is beginning to lose steam near the $101 area.
At the same time, the 15m Bollinger midline at $101.51 sits just above current price. The ATR14 at 1.17 points to tight intraday ranges, suggesting price is coiling rather than trending. For anyone watching intraday levels, the pivot cluster between $100.46 and $101.49 defines the immediate battleground.
Bullish Scenario: What Would Need to Change
A credible bullish case requires more than an intraday bounce. At minimum, MSTR would need a sustained reclaim of the daily EMA20 near $108.91. That level has been acting as resistance. Breaking above it on volume would signal a meaningful shift in short-term structure. Beyond that, a move through the Bollinger midline at $107.84 and then toward R1 at $105.49 would be the logical first milestones.
On the fundamental side, a bullish catalyst would need to address the valuation narrative directly. This could come through a clarification on the mNAV methodology dispute. Alternatively, a stabilization in Bitcoin prices could reverse the unrealized loss trajectory. A credible pivot back toward accumulation would also help. Without at least one of those elements, any technical bounce is likely to face heavy supply at the moving averages overhead.
Bearish Scenario: The Path of Least Resistance
The bearish scenario requires little imagination given the current setup. A failure to hold the daily pivot at $100.06, followed by a break below S1 at $95.34, would put the lower Bollinger band at $78.54 in play. The daily ATR of 10.05 means that kind of move could unfold within a few sessions if selling pressure accelerates. With the RSI at 40.62 — not yet oversold — there is no technical floor forcing buyers in at current levels.
On the fundamental side, further BTC sales announcements would deepen the selloff. Additional quarterly loss disclosures or widening scrutiny of the mNAV accounting would also add pressure. Notably, the stock fell 1% on Monday following the quarterly disclosure. That relatively muted initial reaction does not mean the market has fully absorbed the implications. Sometimes the repricing comes in waves.
Positioning, Volatility, and the Weight of Uncertainty
Overall, MSTR presents a high-risk, high-uncertainty setup. The daily bias is bearish, and the fundamental backdrop has deteriorated meaningfully. The intraday recovery lacks the conviction needed to challenge the dominant downtrend. At the same time, the marginal improvement in the daily MACD histogram and the intraday price recovery above short-term EMAs suggest the stock is not in freefall. It is grinding, under pressure, at a structural inflection.
The ATR environment — $10 on the daily — means this stock can move sharply in either direction. Volatility is a feature, not a temporary condition. Traders and investors should treat that uncertainty with respect.
FAQ
What is the current technical outlook for Strategy Stock?
The daily timeframe is unambiguously bearish. Price at $100.77 trades below the EMA20 ($108.91), EMA50 ($128.54), and EMA200 ($184.21). The RSI14 at 40.62 has not reached oversold territory, leaving room for further downside. The MACD remains in negative territory, though the histogram has turned marginally positive, hinting at slowing downside momentum rather than a reversal.
Why did Strategy sell Bitcoin, and what does it mean for the stock?
Strategy sold approximately 3,588 BTC for $216 million between June 29 and July 5, with proceeds earmarked for distributions on its preferred stock STRC. This marks a departure from its aggressive accumulation identity. The sale, combined with an $8.32 billion quarterly loss on digital assets, signals that financing costs and leverage are placing the original Bitcoin accumulation model under visible strain.
What are the key levels to watch for MSTR?
On the downside, the daily pivot at $100.06 and S1 at $95.34 are critical. A break below S1 would open a path toward the lower Bollinger band near $78.54. On the upside, bulls need to reclaim the daily EMA20 at $108.91 to signal any meaningful shift in short-term structure. The Bollinger midline at $107.84 and R1 at $105.49 are the intermediate milestones.
What is the mNAV controversy surrounding Strategy Stock?
The mNAV metric, used to value MSTR relative to its Bitcoin holdings, reportedly uses face value rather than market value for debt and preferred stock. If accurate, this would overstate the premium at which the stock trades, undermining a core valuation argument used by bulls. The controversy has added uncertainty to how the market prices MSTR relative to its digital asset reserves.
Disclaimer: This article is for informational purposes only and does not constitute financial advice, an investment recommendation, or a solicitation to buy or sell any financial instrument or cryptocurrency. The analysis provided is not indicative of future results. Investing in crypto assets and financial markets carries a high risk of capital loss. Always do your own research (DYOR) and consult a qualified financial advisor before making any decision.
Article produced with the assistance of artificial intelligence and reviewed by the editorial team.
