




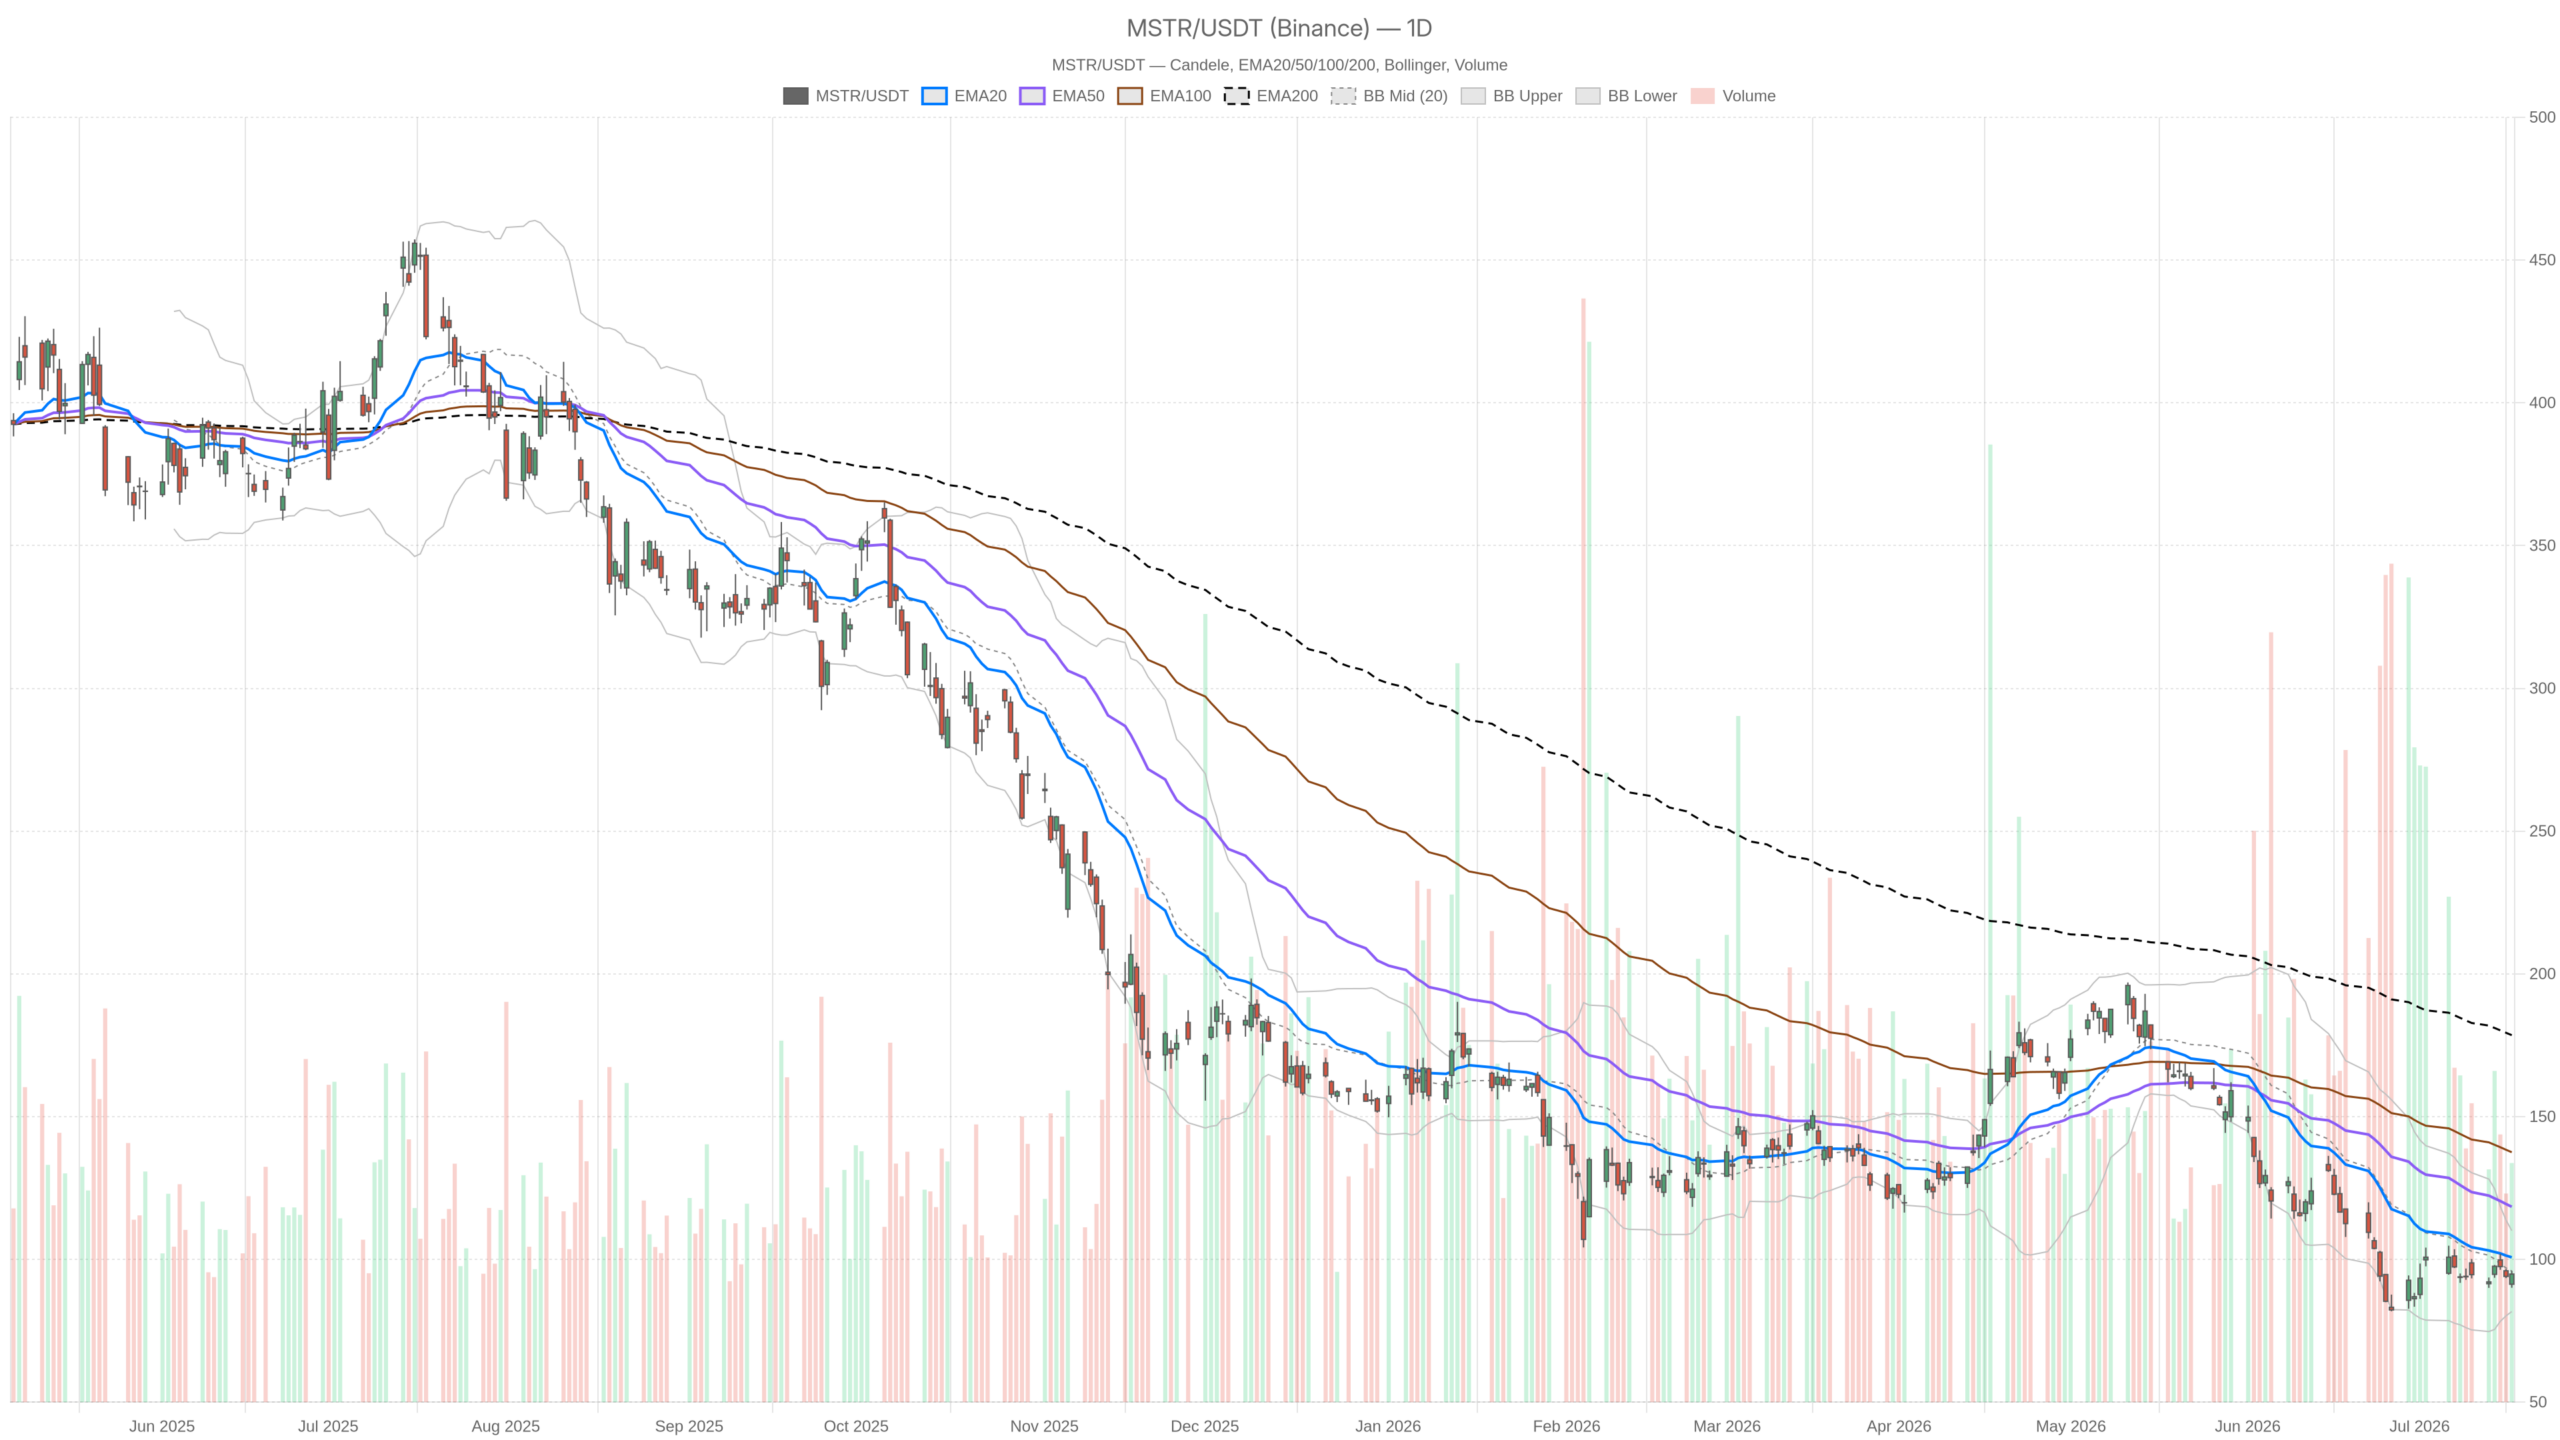
Strategy Stock (MSTR) closed at $94.85 on July 17, trapped below all three major daily EMAs. The trend is unambiguously bearish. Yet early — and fragile — signs of stabilization are emerging across shorter timeframes.
Summary
Key takeaways
- MSTR closed at $94.85 on July 17, well below the daily EMA20 at $100.71, EMA50 ($118.42), and EMA200 ($178.52).
- The daily RSI at 40.1 is not yet oversold, while the MACD histogram turned positive at 2.17 — hinting at slowing bearish momentum.
- Strategy sold $467 million in shares to raise capital; a separate July 17 report pegs the stock as potentially 43% undervalued.
- A daily close above the EMA20 at $100.71 is needed for any bullish shift; losing $91.28 support opens the path to $81.73.
Daily timeframe confirms the Strategy Stock trend is structurally bearish
The daily trend for Strategy Stock is structurally bearish. Price sits well below all three major exponential moving averages, confirming sellers remain firmly in control.
Trend alignment and moving average structure
MSTR trades at $94.85. Meanwhile, the EMA20 sits at $100.71, the EMA50 at $118.42, and the EMA200 at $178.52. Price is progressively deeper below each layer of dynamic resistance. That stacked bearish alignment alone defines the dominant market structure. Buyers have not managed to reclaim even the nearest short-term average.
Momentum and volatility context
The daily RSI at 40.1 reflects persistent selling pressure. It is not in oversold territory, so there is no mechanical bounce signal from momentum alone. However, the MACD line at -8.46 remains negative while the histogram has printed a positive reading of 2.17. The MACD signal line sits at -10.63. That histogram improvement is one of the few constructive signals on the daily chart. It hints at slowing bearish momentum rather than any reversal.
Bollinger Bands place the midline at $95.90, just above current price. The upper band reaches $110.07 and the lower sits at $81.73. MSTR is trading in the lower half of this range, leaning toward the softer end of valuation on a volatility-adjusted basis. The daily ATR of 7.39 confirms this is a high-volatility name. Intraday swings remain wide, and position sizing must reflect that reality.
Pivot analysis puts the daily pivot point at $93.63, with resistance at $97.19 and support at $91.28. The close at $94.85 holds above the pivot. That is a marginally constructive signal — but it does not override the broader bearish regime.
Hourly view: bearish regime persists, though pressure is easing
The bearish regime holds on the hourly chart, but with noticeably less intensity. MSTR trades just fractionally below the short-term EMAs, suggesting sellers are not pressing aggressively at current levels.
On the 1H chart, the EMA20 sits at $94.96 and the EMA50 at $95.40. Price at $94.85 is barely below both. The gap is minimal. Still, MSTR remains below the 1H EMA200 at $107.35, reinforcing that the broader trend is firmly down.
The 1H RSI at 48.79 sits essentially neutral — neither overbought nor oversold. In contrast to the daily reading, this suggests short-term momentum has reset. At the same time, the MACD tells a slightly different story. The line is at -0.40 and the signal at -0.30, producing a negative histogram of -0.10. The bearish MACD cross is shallow, but it still points downward. That limits enthusiasm for any hourly bounce thesis.
The 1H Bollinger midline stands at $95.51. Price is just below it. The upper band reaches $99.00 and the lower touches $92.03. With ATR at 1.96, the intraday range is meaningful. The hourly pivot is at $94.56, with resistance at $95.20 and support at $94.20. The close sits between the pivot and R1. That reflects a modest bid under the market but no real breakout energy.
15-minute frame: short-term execution context turns neutral
The 15-minute chart flips to neutral, which alone is noteworthy. Price has edged above the EMA20, offering a brief clearing of short-term selling pressure.
On this timeframe, the EMA20 at $94.36 has been crossed to the upside. Price closed at $94.85. The MACD line is 0.07 with a signal of 0.03, producing a small positive histogram of 0.03. The RSI at 54.1 leans slightly bullish. These are not powerful signals. However, they reflect a market that has temporarily steadied.
Overall, traders looking for intraday entries would note the 15m EMA200 at $95.52 as immediate overhead resistance. The narrow ATR of 0.74 on this frame suggests compression. That is often a precursor to the next directional move, whichever way it breaks.
Fundamental backdrop adds context to the Strategy Stock valuation debate
Strategy Stock’s fundamental picture is mixed but notable. A sizable equity sale creates near-term dilution pressure. Meanwhile, independent valuation work points to significant upside potential.
On July 15, Strategy sold $467 million worth of its own shares to raise capital. The move carries implications for both dilution pressure and longer-term Bitcoin accumulation capacity. For a name whose identity is built on leveraged Bitcoin exposure, that capital-raising activity signals ongoing commitment to the treasury model.
Notably, a July 17 report suggests Strategy stock could be as much as 43% undervalued. Both DCF intrinsic value estimates and market multiples point to shares trading below assessed worth. Separately, the company asserts it remains “very secure” unless Bitcoin falls below $10,000. These are meaningful data points for longer-horizon investors, even as the chart tells a different short-term story.
In contrast, the recent $467 million equity sale does represent a structural overhang. Moving from a “never sell” philosophy to what one analysis called “disciplined capital management” is a strategic pivot. The market has yet to fully price in whether this reframe is credible or concerning.
Bullish scenario: what Strategy Stock needs to stage a recovery
A bullish reversal for Strategy Stock requires reclaiming the daily EMA20 at $100.71. That level has acted as a ceiling throughout the current downtrend, and clearing it would mark the first meaningful structural improvement.
Additionally, two confirmations would strengthen the case. A turn higher in the 1H MACD histogram would show short-term momentum aligning with recovery. Sustained price action above $95.20 on the hourly pivot would provide further confirmation. The MACD histogram improvement on the daily chart, currently at 2.17, is a necessary but insufficient condition. It must persist and deepen to become actionable.
Bearish scenario: what would invalidate recovery hopes
The bearish case reasserts itself aggressively if MSTR loses daily pivot support at $91.28. A break below that level opens a direct path toward the lower Bollinger Band at $81.73.
The daily ATR of 7.39 means that kind of move could develop within days rather than weeks. The RSI at 40.1 has room to slide toward oversold territory before any mechanical reversal signal triggers. Any renewed selling pressure tied to Bitcoin weakness or broader risk-off sentiment could accelerate that path quickly.
Positioning must account for elevated volatility across all timeframes
MSTR remains a high-conviction, high-risk instrument where the daily bearish trend must anchor all positioning decisions. Shorter-timeframe stabilization does not override the structural damage visible on the daily chart.
Volatility is elevated across every timeframe. The daily ATR alone implies that single-session moves of $7 or more are routine. Any positioning — long or short — must account for that range. The short-term compression visible on the 15-minute frame may resolve the ambiguity soon. Until price reclaims the daily EMA20 with conviction, the burden of proof rests firmly on the bulls.
FAQ
What is the current trend for Strategy Stock (MSTR)?
The daily trend is structurally bearish. MSTR closed at $94.85 on July 17, sitting below all three major exponential moving averages — the EMA20 ($100.71), EMA50 ($118.42), and EMA200 ($178.52). The stacked bearish alignment confirms sellers remain in control.
What key levels should traders watch on MSTR?
On the upside, the daily EMA20 at $100.71 is the first hurdle bulls must reclaim for any meaningful structural shift. On the downside, losing the daily pivot support at $91.28 opens a path toward the lower Bollinger Band at $81.73. The hourly pivot sits at $94.56, with resistance at $95.20.
What is the fundamental backdrop for Strategy Stock right now?
Strategy sold $467 million in shares on July 15 to raise capital, creating near-term dilution pressure. At the same time, a July 17 report suggests the stock could be 43% undervalued based on DCF and market multiple analysis. The company maintains it remains secure unless Bitcoin falls below $10,000.
Is there any sign of a trend reversal for MSTR?
Not yet on the daily timeframe. The MACD histogram has turned positive (2.17), hinting at slowing bearish momentum, but the daily RSI at 40.1 remains in selling territory. Shorter timeframes show early stabilization — the 15-minute chart is neutral — but these fragile signals do not override the dominant daily bearish structure.
Disclaimer: This article is for informational purposes only and does not constitute financial advice, an investment recommendation, or a solicitation to buy or sell any financial instrument or cryptocurrency. The analysis provided is not indicative of future results. Investing in crypto assets and financial markets carries a high risk of capital loss. Always do your own research (DYOR) and consult a qualified financial advisor before making any decision.
Article produced with the assistance of artificial intelligence and reviewed by the editorial team.
