



QUALCOMM Incorporated stock tumbled to $155.68 on July 29 after a weak profit forecast and a 20% handset revenue drop triggered aggressive selling. The shares now sit below all major moving averages, deep in technically oversold territory.
Summary
Key takeaways
- QUALCOMM Incorporated stock closed at $155.68 on July 29, below its daily Bollinger lower band of $158.32.
- Handset revenue dropped 20% in Q3 FY2026, while automotive revenue surged 61% year-over-year.
- Daily RSI at 32.32 and hourly RSI at 26.98 both reflect sustained selling pressure across timeframes.
- The daily MACD histogram continues to expand negatively at -1.04, with no momentum recovery in sight.
- Key support rests at $152.27; a breakdown below could open the path toward $150.
Daily Bias: QUALCOMM Incorporated Stock Forms a Bearish Structure
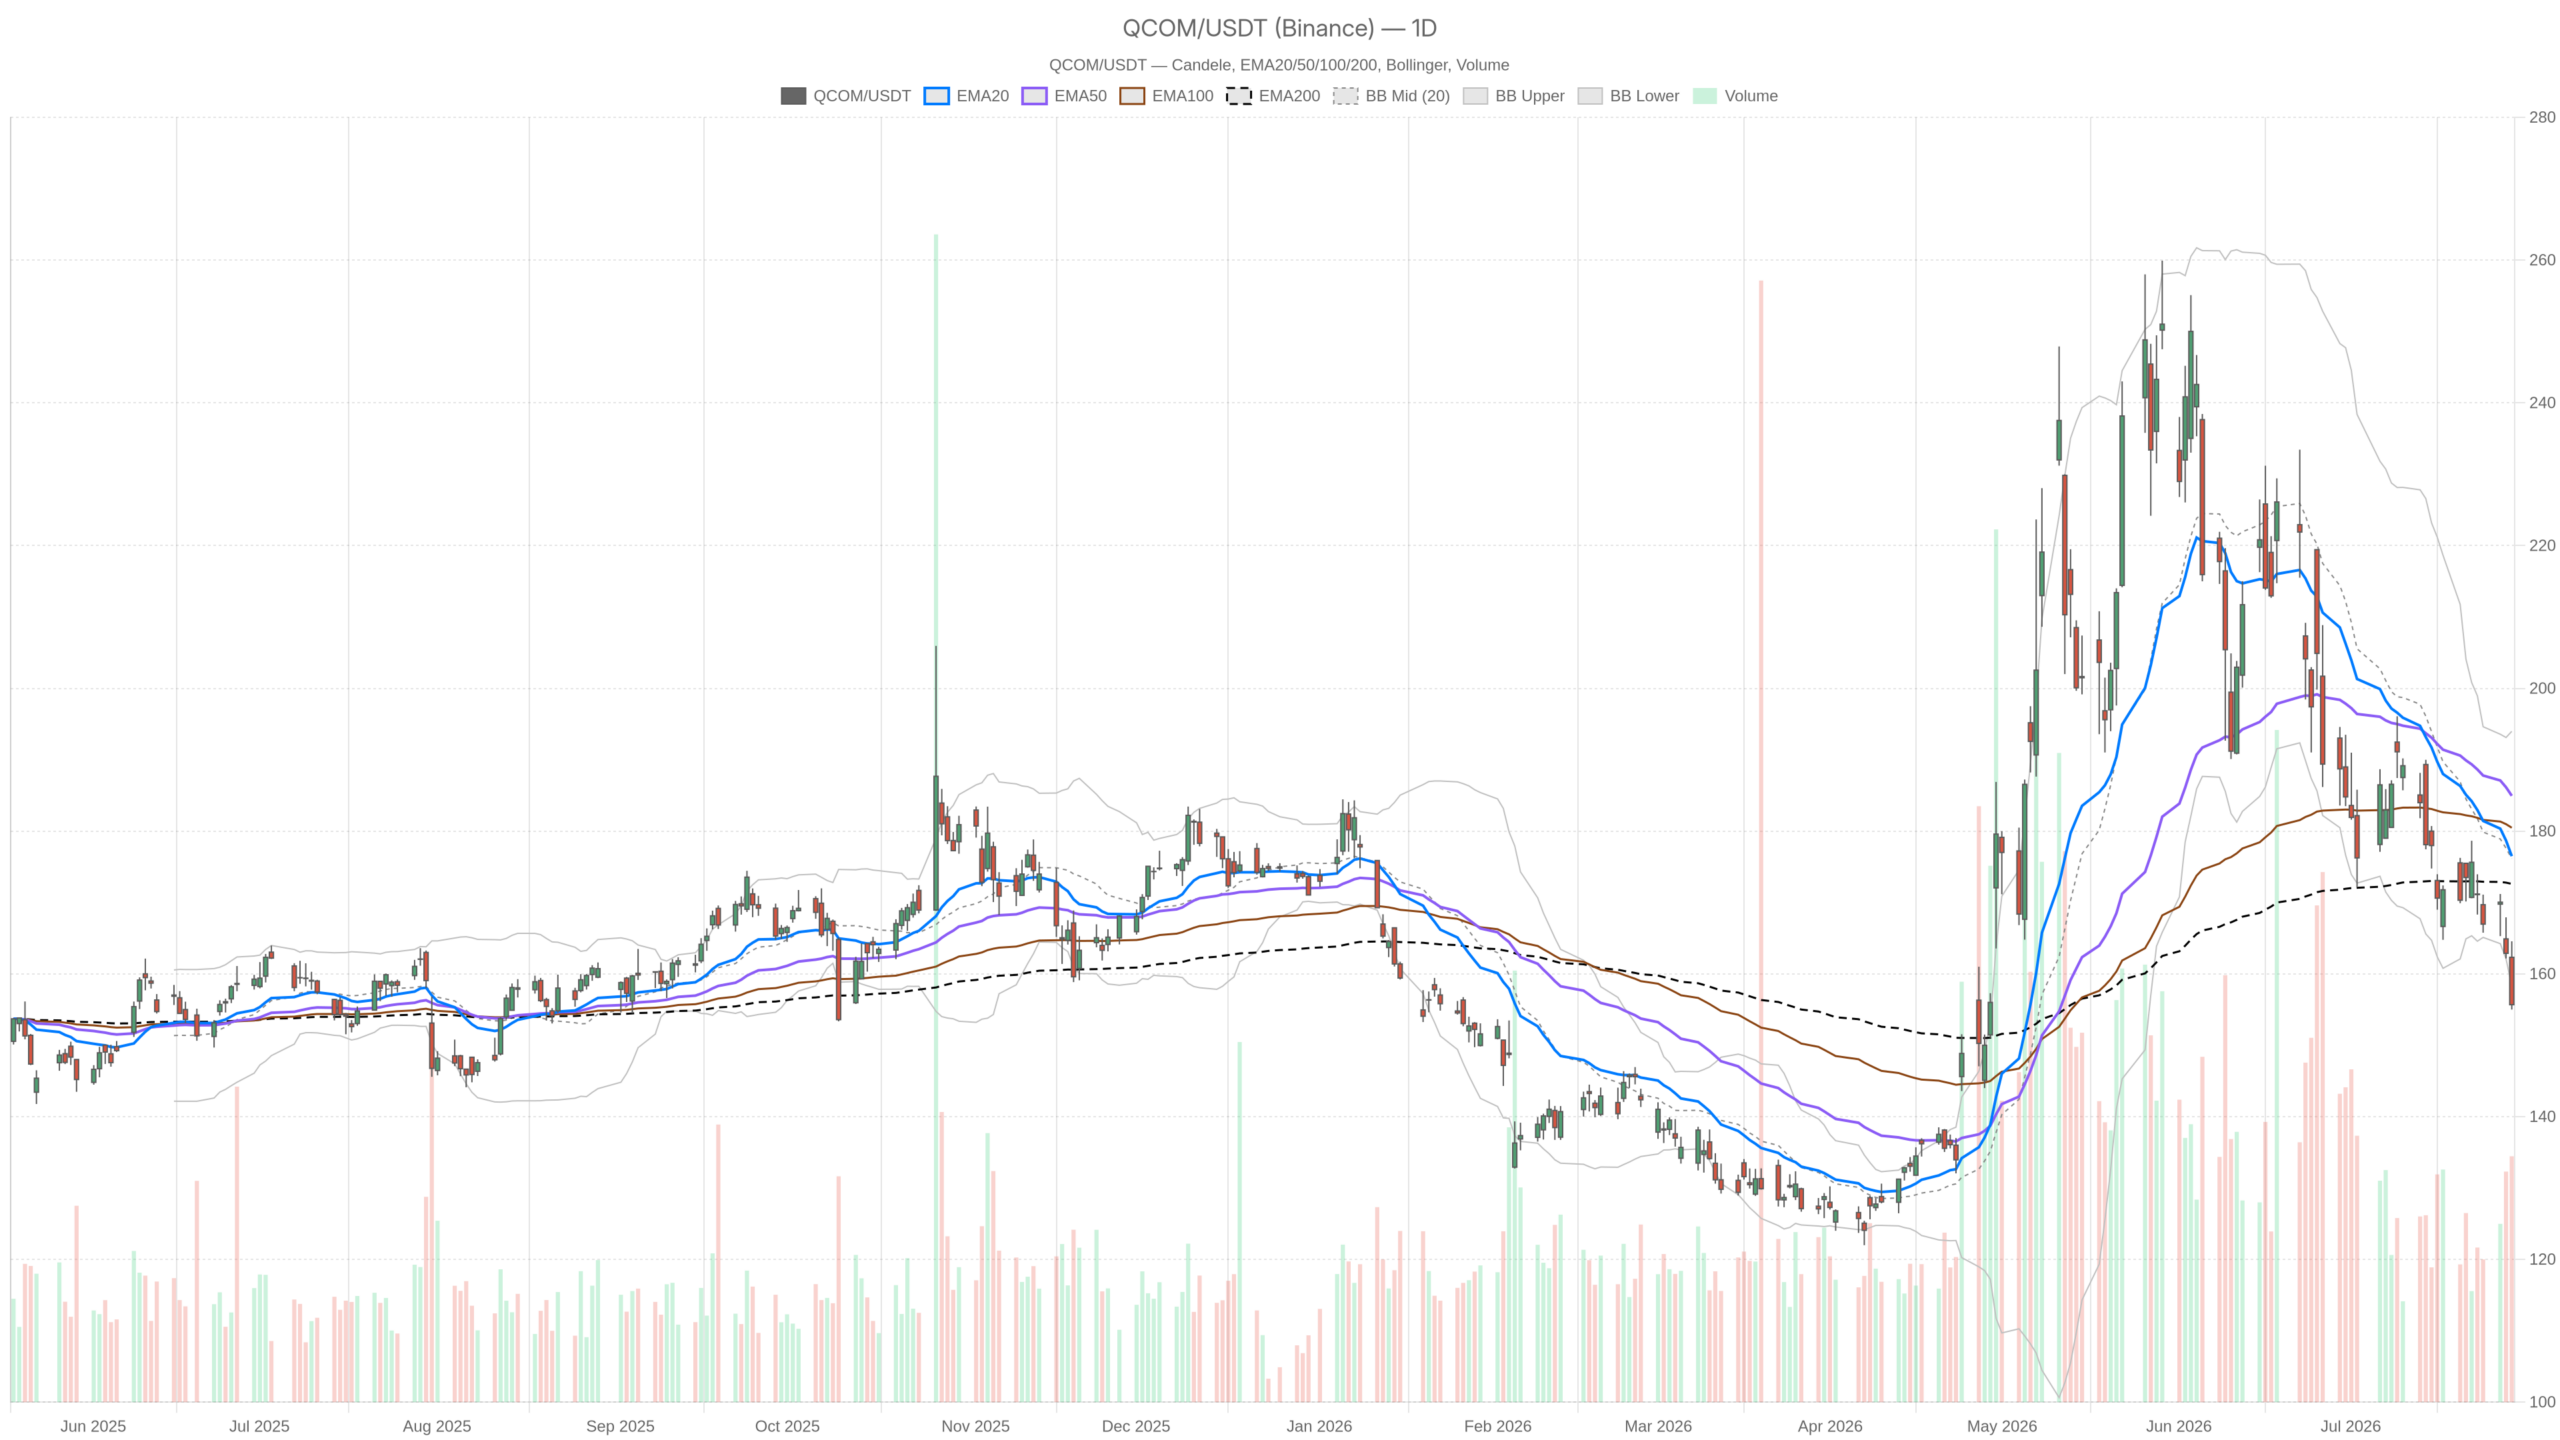
The daily bias is decisively bearish. QUALCOMM Incorporated stock closed at $155.68, well below the EMA20 at $176.49, EMA50 at $184.95, and EMA200 at $172.61. This is a structurally bearish alignment with no ambiguity.
Moving Average Structure Confirms Bearish Alignment
Price printed a high of $164.56 and a low of $155 on the session. The wide-range candle signals aggressive selling. Meanwhile, all three daily EMAs remain stacked above price. The EMA200 at $172.61 now acts as resistance rather than support. Until price reclaims at least one of these averages, the trend structure favors further downside.
Momentum Indicators Show No Exhaustion
The daily RSI sits at 32.32 — close to oversold but not yet at levels that historically trigger sharp mean-reversion bounces. It reflects sustained selling pressure rather than a temporary spike. The daily MACD line is at -9.50 versus a signal of -8.47, producing a histogram of -1.04. The divergence is widening, not narrowing. Momentum still points lower on the daily timeframe.
Notably, the Bollinger Bands on the daily frame show a midpoint of $176.15 and a lower band of $158.32. Price at $155.68 has now broken below that lower band. This kind of breach typically reflects a volatility event rather than orderly trend movement. The daily ATR of $7.40 underscores how elevated intraday swings have become. Daily pivot support sits at $152.27, while resistance stands at $161.83. The stock closed beneath the pivot point of $158.41, confirming bearish short-term structure.
Hourly Confirmation: Bears Are in Full Control
The hourly chart confirms bears remain in full control. The hourly RSI collapsed to 26.98 — firmly in oversold territory. That alone does not reverse a trend, but it does flag the risk of a technical snap-back at any moment.
The hourly MACD line stands at -2.87 against a signal of -2.42, with the histogram at -0.45 and still expanding to the downside. No hourly momentum recovery is in sight yet. Price at $155.28 sits well beneath the EMA20 at $163.09, EMA50 at $167.42, and EMA200 at $184.48. The regime is explicitly bearish.
Notably, the hourly Bollinger lower band at $156.07 was breached intraday. This confirms the daily sub-band break is not an isolated reading. Both timeframes show extreme downside extension. The hourly ATR of $3.30 indicates the market remains highly volatile on an intraday basis. Overall, the 1H frame provides no material support for a bullish reversal thesis.
Execution Context: 15-Minute Signals Remain Weak
The 15-minute chart offers no reversal signal. The 15m RSI at 30.37 hovers near oversold. The MACD histogram stands at -0.18 — negative but compressing slightly. This could hint at very short-term selling exhaustion. However, it falls well short of a reversal signal.
All three EMAs on the 15m remain stacked above price at $160.66, $162.32, and $167.62. The 15m Bollinger lower band is at $156.70, with price just below it at $155.28. Near-term support from the 15m pivot sits at $153.83. This level needs to hold to prevent a further leg down toward $152.27 on the daily.
The Fundamental Catalyst: Earnings Shock and Strategic Uncertainty
The technical damage stems directly from Qualcomm’s Q3 FY2026 earnings shock. Handset revenue dropped 20%. Management acknowledged rising memory costs are squeezing margins. Additionally, Apple-related revenue is stepping down materially. Pre-market trading on July 30 reflected a further 5% decline in response to tepid Q4 guidance. That additional leg lower will likely extend the technical damage already visible in the charts.
In contrast, there were genuine positives buried in the report. Automotive revenue surged 61% year-over-year. Qualcomm raised its automotive exit run rate target to $7 billion. The company also outlined a $40 billion non-handset revenue target by fiscal 2029, including a new data center revenue stream. IoT revenue grew 9%. These are not trivial growth vectors. However, they are not yet large enough to offset concerns about core handset weakness and near-term margin compression.
Bullish Scenario: What Could Stabilize QUALCOMM Incorporated Stock
A bullish recovery would require QUALCOMM Incorporated stock to hold above $152.27 daily pivot support. A decisive reclaim of the $158.41 pivot point would be the first sign that sellers are losing momentum. Beyond that, recapturing the daily Bollinger lower band at $158.32 would suggest the band breach was a spike rather than a breakdown.
From a fundamental standpoint, Qualcomm’s claim that Q3 represents the handset revenue bottom is critical. If Q4 data confirms stabilization, the market could begin pricing in the automotive and data center growth story more aggressively. The long-term $40 billion non-handset revenue ambition is a real narrative. It simply needs time and execution proof.
Bearish Scenario: What Could Accelerate the Decline
The bearish case remains straightforward and well-supported by the data. A failure to hold $152.27 on the daily would open space toward $150 and potentially lower. No meaningful technical support structure is visible below that level in the current data.
If memory cost pressures intensify further, or if Apple’s modem transition accelerates faster than guided, the handset weakness could persist beyond Q3. This would invalidate the “bottom is in” thesis entirely. The daily MACD histogram is still expanding negatively. Until that turns, any rally is more likely a selling opportunity than a sustainable inflection. Furthermore, tightened semiconductor supply chains are driven by surging AI infrastructure spending. This creates a headwind Qualcomm cannot easily resolve through internal execution alone.
Positioning, Volatility, and the Path Forward
QUALCOMM Incorporated stock is currently in a high-volatility, post-earnings dislocation. The daily ATR of $7.40 and hourly ATR of $3.30 make this a wide-range environment unsuitable for tight stops. The RSI readings across all three timeframes are approaching or in oversold territory. This reduces the reward-to-risk for aggressive new short positions at current levels.
At the same time, no reversal signal has been confirmed. The daily and hourly MACD remain in negative divergence. Initiating long positions without clear price structure stabilization would be premature. The $152.27–$158.41 zone is the immediate battleground. How QCOM behaves within that range over the next sessions will likely define the outcome. This selloff could prove to be a buying opportunity — or the beginning of a deeper structural repricing.
FAQ
Why did QUALCOMM Incorporated stock drop sharply?
QUALCOMM Incorporated stock fell after reporting a 20% drop in handset revenue for Q3 FY2026 and issuing weak Q4 guidance. Rising memory costs and declining Apple-related revenue added to the selloff. Pre-market trading on July 30 showed an additional 5% decline.
What are the key support levels for QCOM?
The immediate support sits at $152.27, the daily pivot support level. Below that, the next psychological level is $150. The 15-minute pivot support at $153.83 must also hold to prevent a rapid move toward the daily support.
Is QUALCOMM Incorporated stock technically oversold?
The daily RSI at 32.32 is approaching oversold levels, while the hourly RSI at 26.98 is firmly oversold. However, the daily MACD histogram is still expanding negatively. This suggests momentum has not exhausted and no reversal has been confirmed.
What growth areas did Qualcomm highlight in its earnings report?
Automotive revenue surged 61% year-over-year. Qualcomm raised its automotive exit run rate target to $7 billion. The company also outlined a $40 billion non-handset revenue target by fiscal 2029, including a new data center revenue stream. IoT revenue grew 9%.
Disclaimer: This article is for informational purposes only and does not constitute financial advice, an investment recommendation, or a solicitation to buy or sell any financial instrument or cryptocurrency. The analysis provided is not indicative of future results. Investing in crypto assets and financial markets carries a high risk of capital loss. Always do your own research (DYOR) and consult a qualified financial advisor before making any decision.
Article produced with the assistance of artificial intelligence and reviewed by the editorial team.
