




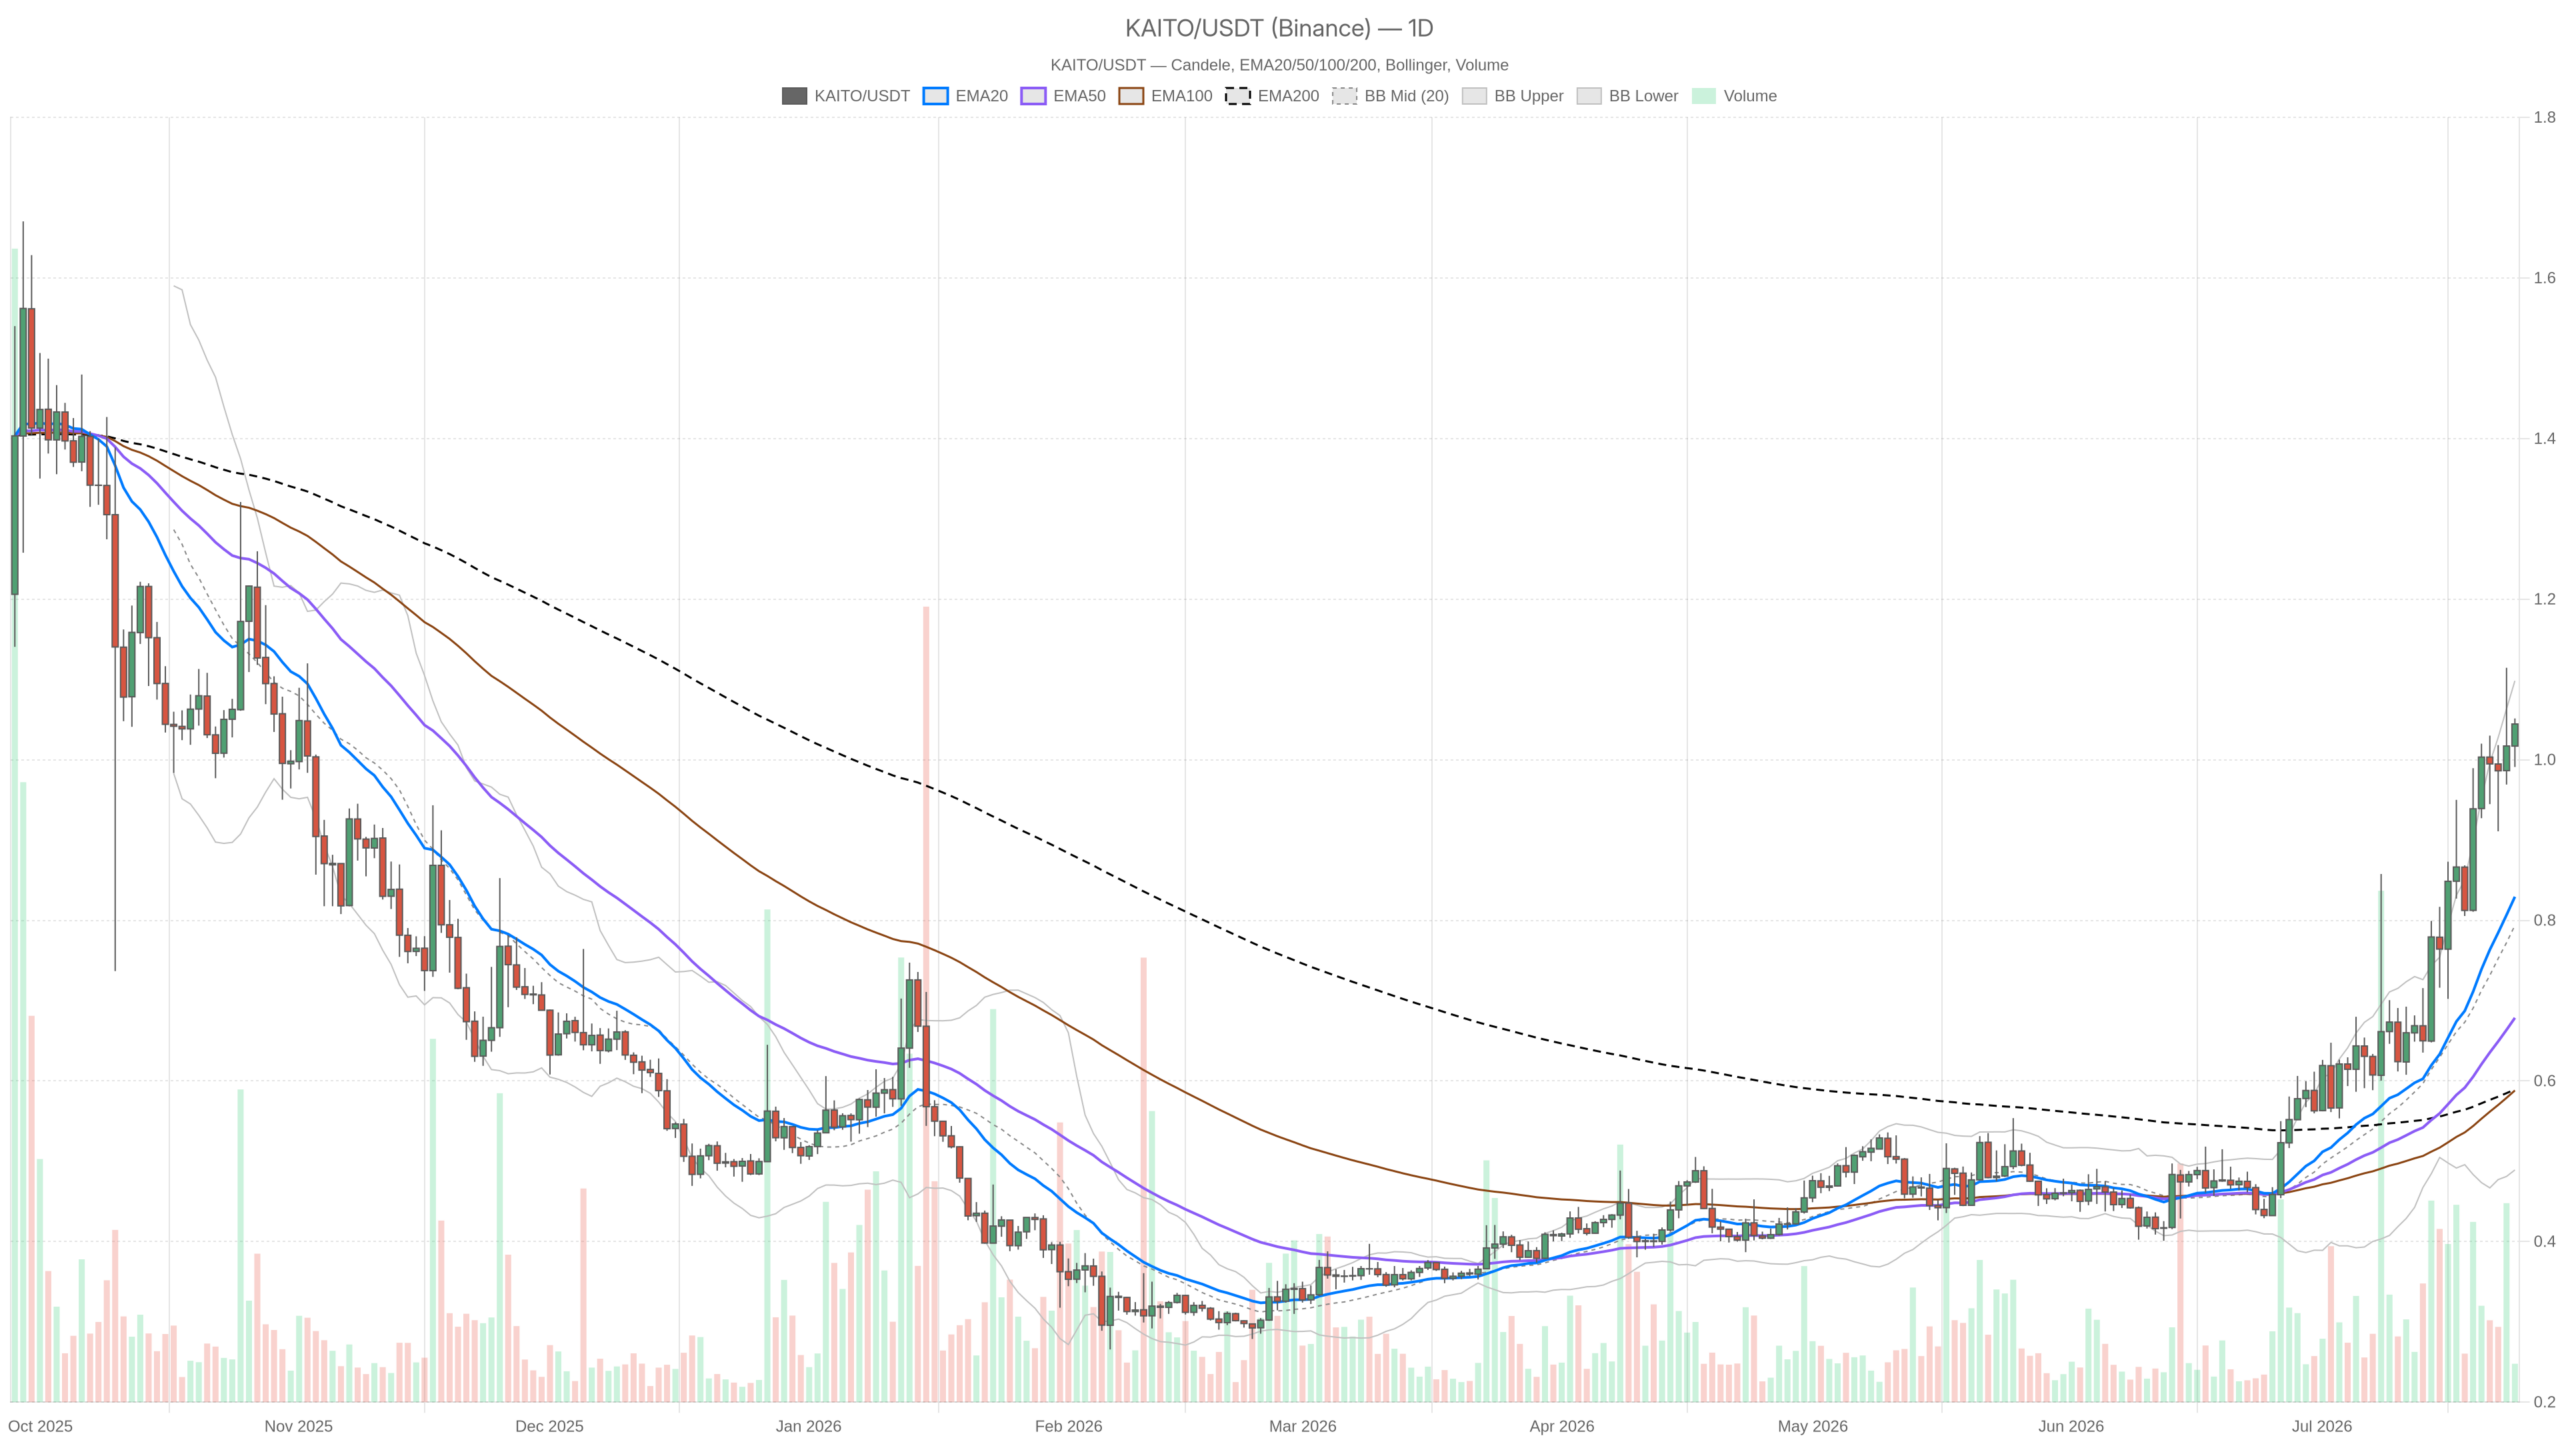
As of July 24, 2026, an asset trades at $1.05 against USDT, having cleared every major daily EMA and pushed above the $1.00 psychological threshold. The setup looks clean, but the daily RSI sits at 77.14 — deep in overbought territory — while the broader market flashes a Fear reading of 28.
Summary
Key takeaways
- The asset has cleared all daily EMAs and broken above the $1.00 psychological level as of July 24, 2026.
- The daily RSI reading of 77.14 places the asset deep in overbought territory, signaling potential exhaustion.
- The broader crypto market shows a Fear & Greed Index of 28, with total market cap declining 1.15% in 24 hours.
- Intraday timeframes (1H and 15M) show consolidation with compressed Bollinger Bands, indicating an imminent expansion move.
- Key levels to monitor: support at $1.01 (S1) and resistance at $1.07 (R1).
The Macro Backdrop: Strength in a Cautious Market
The wider crypto market is not providing a tailwind right now. Bitcoin dominance sits at 56.70%, per CoinGecko data, signaling that capital still gravitates toward the largest assets rather than rotating freely into mid- and small-cap tokens. Total crypto market capitalization stands at approximately $2.30 trillion, but the 24-hour decline of 1.15% confirms that sellers remain active at current levels.
DEX activity on Uniswap V3 shows a 30-day fee increase of 137.39%, which hints at genuine on-chain engagement in parts of the market. That momentum, however, has not translated into broad risk appetite. The asset’s ability to hold above $1.04 in this environment signals either genuine relative strength or the final leg of a buyer-exhausted move. Determining which one requires a closer look at the structure.
Daily Chart: Dominant Trend, Stretched Momentum
The daily timeframe is where the macro thesis for this asset lives, and right now it is unambiguously bullish in structure — with one significant caveat. Price on the daily close sits well above the EMA20 at $0.83, EMA50 at $0.68, and EMA200 at $0.59. That stack — price above all three averages, with each shorter-period EMA above the longer — provides textbook trend confirmation. The gap between current price and the EMA200 stands at nearly 76%, indicating this move has been running for some time.
That is where the RSI of 77.14 becomes the dominant conversation. At this level, the daily momentum oscillator sits in territory that historically precedes either a consolidation or a sharper mean-reversion move. Moreover, the MACD confirms trend direction — the line at $0.12 sits above the signal at $0.10, with a positive histogram at $0.02 — but the histogram’s slim margin indicates the impulse is decelerating rather than accelerating. This does not guarantee a top, but it does suggest the easy money on this leg has likely been made.
The Bollinger Bands frame the price action candidly: current price approaches the upper band at $1.10, with the midline at $0.79. Price hugging the upper band during a trend is normal. However, when the RSI is simultaneously at 77 and the MACD histogram is compressing, the upper band becomes more of a ceiling than a magnet. The daily ATR of $0.11 means a single bad session could easily test the $0.93–$0.95 area without breaking the macro structure.
Meanwhile, daily pivot levels place the pivot point at $1.03, with R1 resistance at $1.07 and S1 support at $1.01. Price above the daily pivot and below R1 means the immediate structure is constructive, but there is limited upside to the next defined resistance level.
Intraday Confirmation: The 1H and 15M Tell a Quieter Story
Drop to the 1-hour chart and the picture shifts considerably in tone. Price at $1.05 sits just above the EMA20 at $1.03 and EMA50 at $1.01 — both close together and below price, confirming short-term bullish structure. The 1H RSI at 56.68 sits in a healthy neutral-bullish zone, far from overbought, which means there is no immediate momentum exhaustion on this timeframe. Crucially, the MACD on the 1H is essentially flat, with line, signal, and histogram all reading at zero.
Meanwhile, the 1H Bollinger Bands have price sitting precisely at the upper band, with the midline at $1.03 and the lower at $1.01. That tight band compression — spanning just $0.04 — reflects low intraday volatility and a consolidating environment. The 1H ATR of $0.02 confirms this: hourly candles are moving in very narrow ranges. The 1H pivot structure, with PP at $1.04, R1 at $1.06, and S1 at $1.03, reinforces a short-term range between $1.03 and $1.06.
The 15-minute chart essentially mirrors the 1-hour in its conclusions: price at $1.05 sits above all EMAs, RSI at 60.01 is constructive but not stretched, MACD is flat, and the Bollinger Bands are similarly compressed with a range of just $0.03. The 15-minute ATR of $0.01 makes this timeframe relevant primarily for precise entries rather than directional bias. Consequently, these lower timeframes collectively communicate that the asset is consolidating at elevated levels — which can resolve either as a continuation breakout or as the beginning of a rotation lower.
The Bullish Case and What Would Break It
For bulls, the setup is a trend continuation play dressed in consolidation clothing. Every moving average is aligned, the daily regime is confirmed bullish, and the asset holds above the $1.03 daily pivot while the broader market remains under pressure. If the asset can clear daily R1 at $1.07 on volume, the next target implied by the Bollinger upper band is $1.10. A sustained move above $1.10 would represent a genuine breakout from the current structure and open a leg that is harder to quantify with available data.
What invalidates this scenario: a daily close below the $1.01 S1 level, especially on expanding volume, would signal that buyers are losing conviction at these elevated levels. A break below $1.00 — the psychological threshold that was only recently cleared — would be structurally meaningful and likely trigger a more aggressive move toward the EMA20 around $0.83. Given the daily ATR of $0.11, that kind of move could unfold quickly.
The Bearish Case and What Would Break It
The bearish argument here is not about the trend — it is about timing and exhaustion. A daily RSI at 77.14 combined with a flattening MACD histogram and price pressing the upper Bollinger Band creates conditions where a pullback becomes the path of least resistance, even in an intact uptrend. The macro context — Fear & Greed at 28, total market cap declining — adds external pressure. In this scenario, the asset fades from current levels toward the $0.93–$0.95 range, consolidates, and potentially reloads for the next attempt higher.
Conversely, what invalidates the bearish case: any decisive move above $1.07 that sticks on the daily close would demonstrate that buyers are actively absorbing supply at these levels. At that point, the RSI being elevated becomes a feature of momentum strength rather than a warning sign.
Positioning Context: Reading Between the Lines
What this setup ultimately demands is patience over conviction. The structural trend remains intact and impressive — the distance between current price and the EMA200 alone tells you that significant directional work has already been done. However, the daily RSI at 77.14 means the risk-reward for new long entries at $1.05 is compressed. The potential reward to $1.07–$1.10 is real but modest in percentage terms, while the potential drawback to $0.93–$0.83 represents a much larger absolute move if the daily RSI reverts even partially.
Volatility, as measured by the daily ATR of $0.11, remains meaningful relative to current price — roughly a 10% daily range potential. In a market where Fear & Greed is at 28 and Bitcoin dominance nears 56.70%, that volatility can spike in either direction without much warning. The consolidated intraday picture — tight Bollinger Bands on both the 1H and 15M — often precedes an expansion move. Monitoring the $1.01 support and $1.07 resistance as the two lines in the sand will tell you everything about which scenario is playing out in real time.
FAQ
What is the asset’s current price and market position?
As of July 24, 2026, the asset trades at $1.05 against USDT, having broken above the psychological $1.00 level. It sits above all major daily EMAs (EMA20 at $0.83, EMA50 at $0.68, EMA200 at $0.59), confirming a bullish structure, while the broader market shows a Fear & Greed reading of 28.
Is the asset overbought right now?
Yes, the daily RSI reads 77.14, which places the asset deep in overbought territory. This suggests momentum is stretched on the daily timeframe and historically precedes either consolidation or a pullback. However, intraday RSI readings — 1H at 56.68 and 15M at 60.01 — remain neutral, indicating no immediate exhaustion on shorter timeframes.
What are the key levels to watch?
The critical support level is $1.01 (daily S1), with a breakdown below $1.00 carrying structural significance. On the upside, R1 resistance sits at $1.07, with the Bollinger upper band at $1.10 acting as the next major target. The daily ATR of $0.11 means these levels can be tested within a single session.
The tension between the asset’s bullish structure and the overbought daily RSI defines the current trading environment. With the broader market cautious and intraday timeframes consolidating, the next directional move will likely be decisive. Traders watching the $1.01–$1.07 range will have clear signals regardless of which scenario materializes.
Disclaimer: This article is for informational purposes only and does not constitute financial advice, an investment recommendation, or a solicitation to buy or sell any financial instrument or cryptocurrency. The analysis provided is not indicative of future results. Investing in crypto assets and financial markets carries a high risk of capital loss. Always do your own research (DYOR) and consult a qualified financial advisor before making any decision.
Article produced with the assistance of artificial intelligence and reviewed by the editorial team.
