



Nebius Stock faces a critical juncture after shedding roughly 40% from its all-time high. NBIS closed at $182.62 on July 20, below key moving averages. Nvidia’s disclosed 9.3% stake offers a fundamental catalyst. Yet the daily chart still warns of downside risk.
Summary
Key takeaways
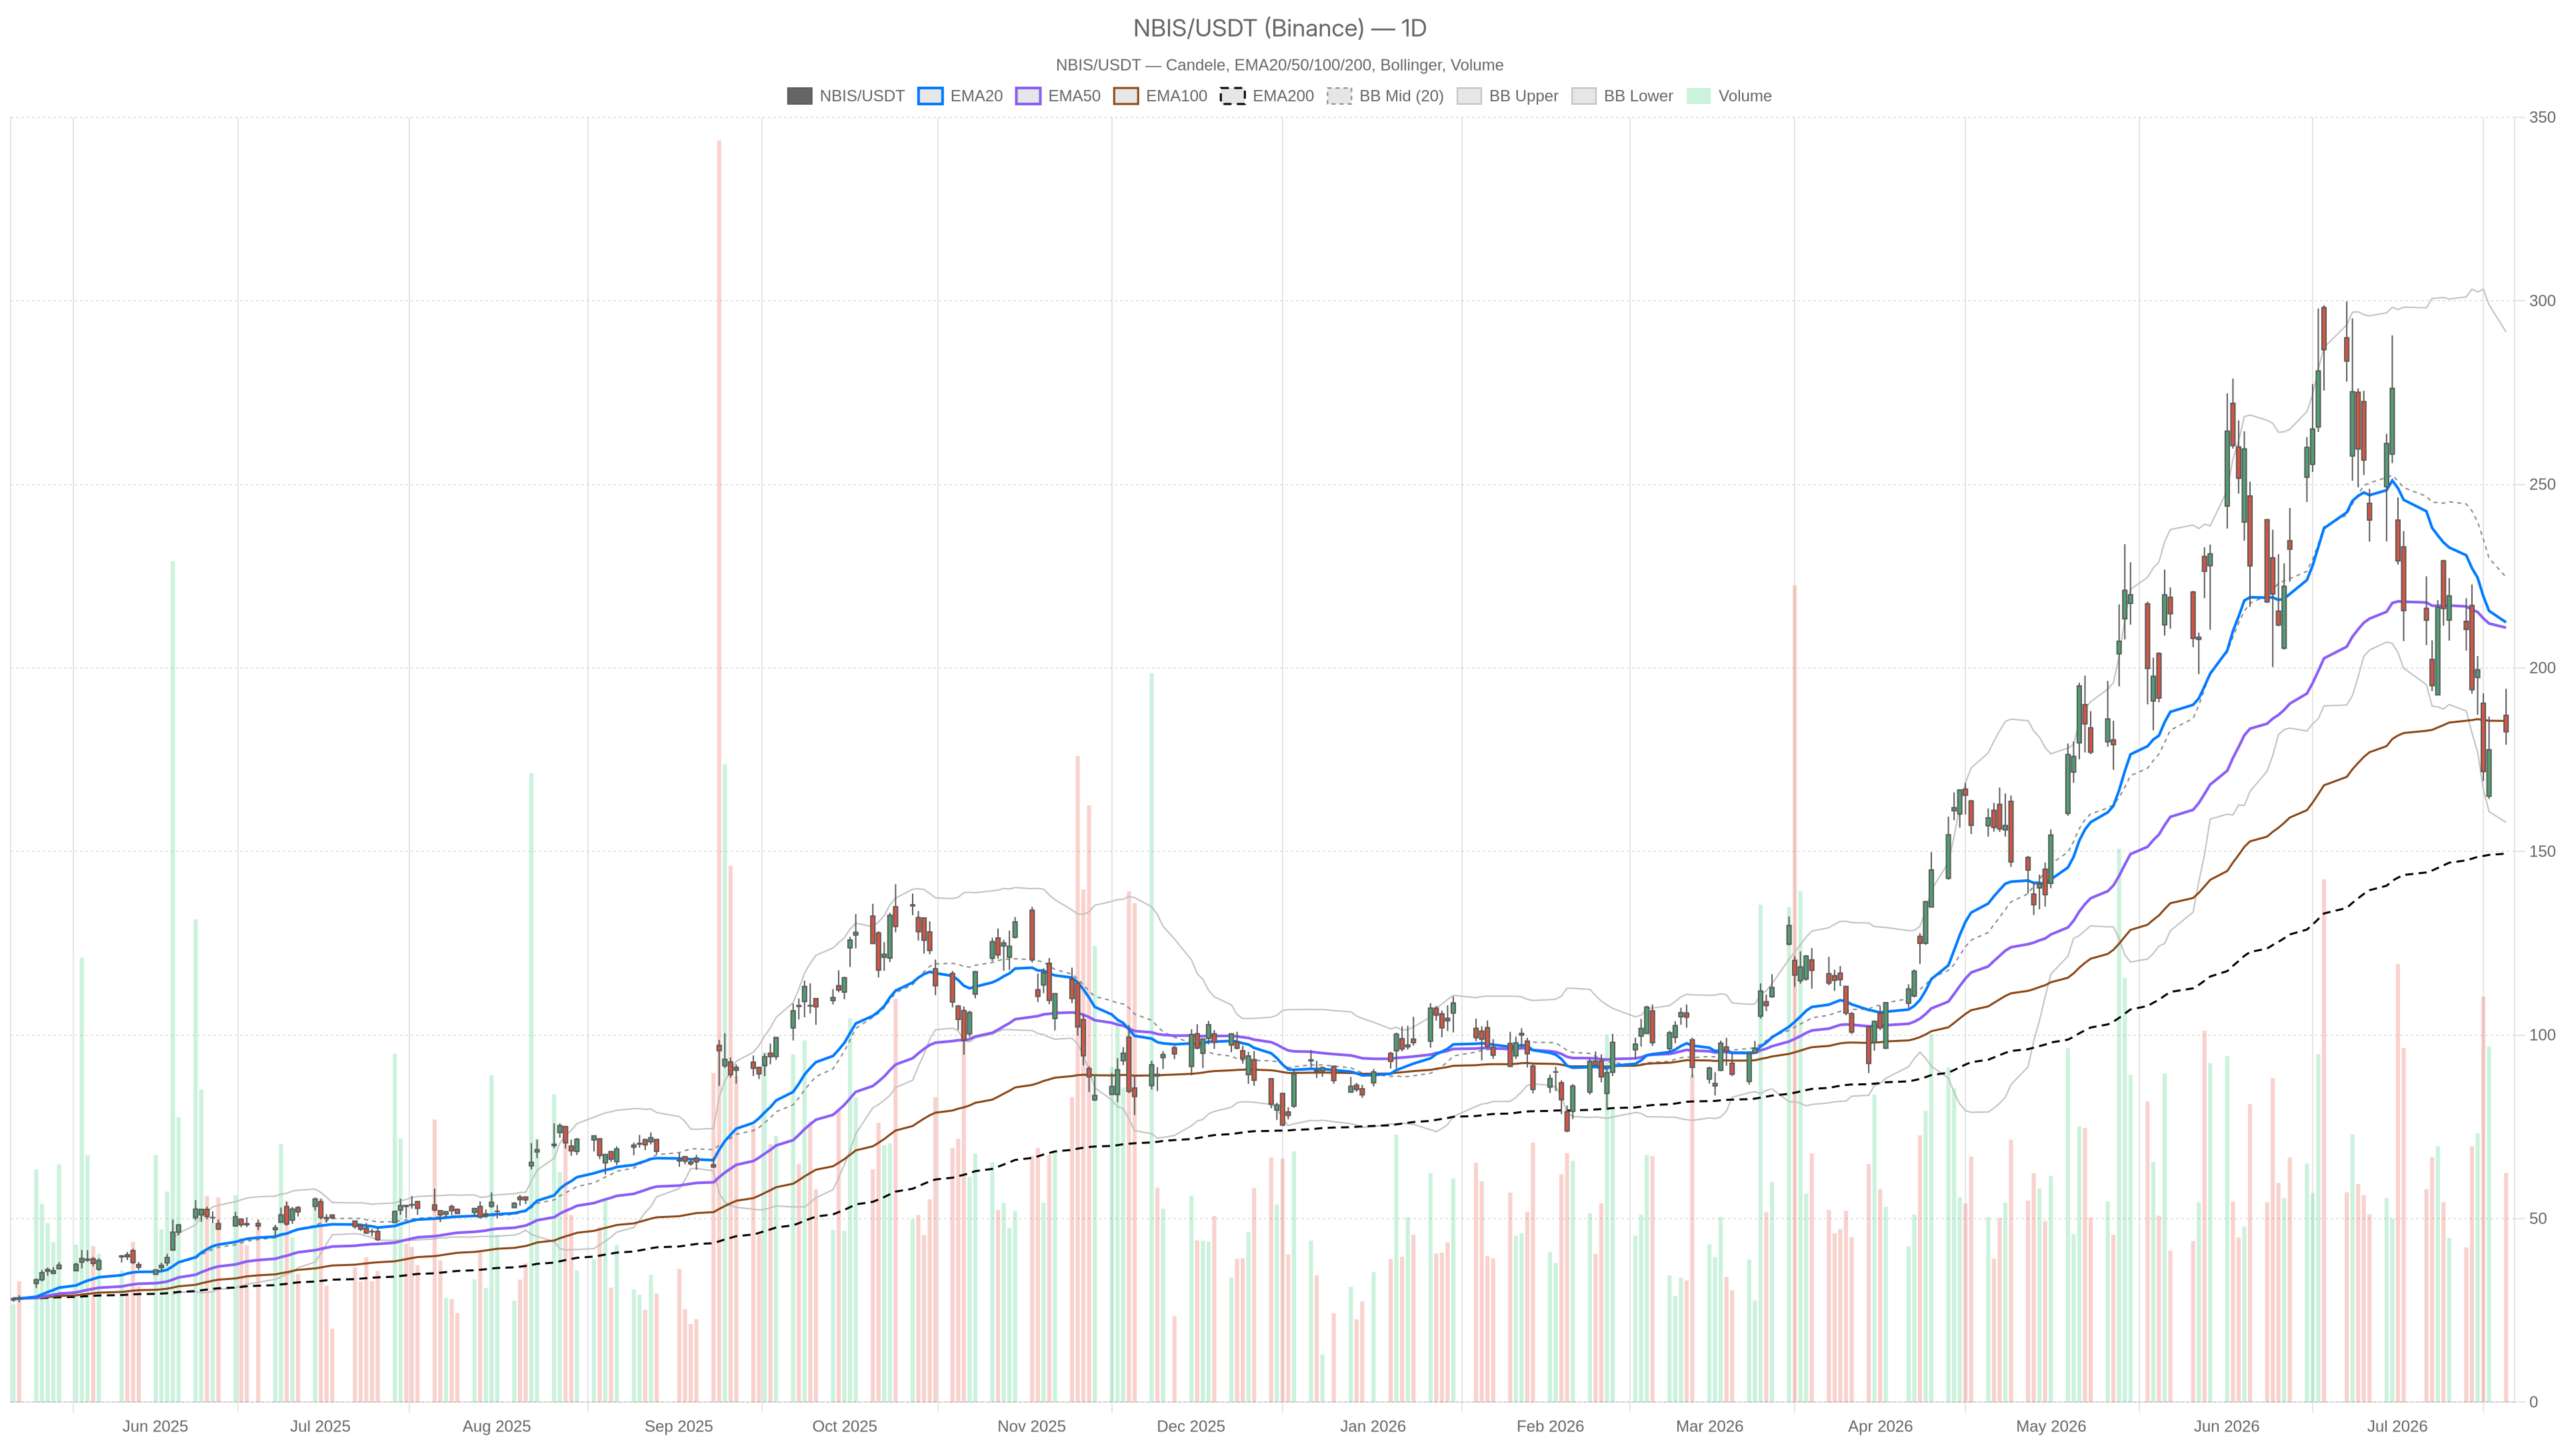
- NBIS closed at $182.62 on July 20, roughly 40% below its all-time high.
- Daily EMA20 at $212.42 and EMA50 at $210.97 sit far above price, confirming a sustained downtrend.
- Daily RSI14 at 39.44 signals weakness but has not yet reached oversold territory.
- Nvidia disclosed a 9.3% stake, exceeding the $2 billion investment announced in March.
- Daily MACD histogram at -6.85 points to widening bearish momentum on the primary timeframe.
Daily Bias: Bearish Pressure Dominates Nebius Stock’s Structure
The daily chart presents a firmly bearish outlook for Nebius Stock. Price closed at $182.62, far below both the EMA20 at $212.42 and the EMA50 at $210.97. Both short- and medium-term averages are stacked well above price. This confirms the recent downtrend has been meaningful and sustained. However, the EMA200 at $149.41 sits below current price. That provides longer-term structural support and prevents the picture from being entirely bearish.
Momentum Indicators Flash Warning Signals
The RSI14 on the daily stands at 39.44, approaching oversold territory without triggering it. The stock is weak but not yet at exhaustion levels that attract strong dip buyers. Meanwhile, the MACD line reads -13.65 against a signal of -6.80. The histogram prints at -6.85. The gap is widening, not contracting — a clear bearish momentum signal. Sellers remain firmly in control on the daily timeframe.
Volatility Context and Pivot Levels
Bollinger Bands on D1 place the midline at $224.72. The upper band sits at $291.52 and the lower at $157.91. Price trades in the lower half of the range, closer to the lower band. This confirms distribution pressure. The ATR14 of $24.41 signals high daily volatility. Any move, in either direction, could be wide and fast.
Daily pivot analysis shows a pivot point at $185.35, resistance at $191.61, and support at $176.35. Price closed just below the pivot. Bulls failed to reclaim a structurally meaningful level heading into the session close.
Hourly Timeframe: Bearish Regime With Early Stabilization Signs
The hourly chart for Nebius Stock remains in a bearish regime, but early stabilization signals are emerging. Price at $182.62 sits below the EMA50 at $193.54 and well below the EMA200 at $218.76. Notably, the 1H EMA20 sits at $184.37 — just above price. That makes it the nearest overhead resistance for any intraday recovery attempt.
On the hourly, RSI14 reads 45.85 — neutral to slightly bearish, but not deeply so. The 1H MACD histogram has turned positive at +1.35. The MACD line at -2.74 remains below the signal at -4.10. However, this histogram uptick hints that selling pressure may be temporarily easing. It does not reverse the daily bias, but it complicates the short-term picture.
The 1H Bollinger Bands place price between the midline at $180.21 and the upper band at $189.27. Price above the midline is a modest intraday positive. Hourly ATR14 of $7.46 confirms the stock is volatile at every timeframe. Even hourly swings are meaningful in absolute terms.
15-Minute View: Execution Context and Short-Term Neutrality
The 15-minute chart reflects a neutral regime for Nebius Stock heading into the close. Price sits between compressed moving averages, suggesting near-term stabilization. It closed at $182.62, below the EMA200 at $192.85 but above the EMA20 ($183.75) and EMA50 ($183.46). This micro-level EMA compression points to very short-term stabilization.
The 15m MACD histogram is slightly negative at -0.62. The MACD line at -0.10 has crossed below the signal at 0.52. That is a mild short-term sell signal on a neutral backdrop. RSI at 47.44 shows no directional conviction. Meanwhile, the 15m ATR of $2.34 indicates compressed near-term volatility. A tightening range often precedes a directional move.
The Nvidia Catalyst: Fundamental Fuel in a Broken Technical Picture
Nvidia’s disclosed 9.3% stake in Nebius Stock is unambiguously positive from a fundamental perspective. The stake exceeds what was implied by the initial $2 billion investment announcement. It signals a deeper strategic alignment between Nvidia and Nebius as an AI cloud infrastructure operator. Analyst commentary accompanying the news points to more upside potential.
However, a fundamental catalyst does not automatically repair a broken chart. The stock appeared as a notable mover on Tuesday. It was also the subject of a Motley Fool piece questioning whether the 40% drawdown makes it a buy. That divergence — positive news flow versus a technically impaired chart — defines the core tension traders face.
Bullish Scenario: What Would Change the Narrative for Nebius Stock
A bullish reversal for Nebius Stock requires the Nvidia-driven momentum to sustain above the daily pivot at $185.35. A clean break and hold above that level would mark an initial technical shift. From there, a push toward the 1H resistance at $193.54 — the hourly EMA50 — would add conviction. Above that, the next meaningful target cluster sits near $191.61, the daily R1 level.
For the broader daily trend to turn, NBIS would need to reclaim the EMA20 area around $212. That is a large distance from current price. In the near term, bulls would be satisfied with stabilization above $176.35 (daily S1). A gradual compression of the daily MACD spread would also help. The 1H histogram’s positive flip is the one early signal supporting that scenario.
Bearish Scenario: What Would Invalidate the Recovery Case
If Nebius Stock fails to hold above the daily pivot at $185.35, the path toward $176.35 opens quickly. A break below daily S1 would expose the stock to a deeper test. The daily lower Bollinger Band sits at $157.91. This aligns with the EMA200 support at $149.41. That zone represents the structural floor. Reaching it, however, would confirm a breakdown rather than a buying opportunity.
The widening MACD histogram on the daily is the clearest warning sign. Momentum deterioration at the daily level tends to override intraday recoveries. If the 1H MACD histogram positive reading reverses back negative, the short-term stabilization thesis collapses quickly.
Positioning and Final Assessment
Nebius Stock sits in a high-volatility, technically damaged structure. Yet it carries a meaningful fundamental tailwind from Nvidia’s larger-than-expected stake. The daily timeframe remains the dominant reference point and signals caution. The 1H offers a tentative hint of stabilization. At the same time, the 15m is neutral and consolidating. These timeframes are not in agreement. That conflict itself is a risk factor.
Overall, the risk-reward for aggressive long entries remains unfavorable. NBIS must reclaim and hold above key structural levels before confidence improves. The Nvidia catalyst is real, but it needs validation by price. With a daily ATR of $24.41, volatility will punish poorly-timed entries. Patience and level-watching — not thesis-chasing — are what this setup demands.
FAQ
What is the key support level for Nebius Stock right now?
Daily S1 support sits at $176.35. Below that, the daily lower Bollinger Band at $157.91 and the EMA200 at $149.41 form the structural floor.
Why did Nebius Stock jump despite the bearish technical picture?
Nvidia disclosed a 9.3% stake in Nebius, exceeding the initial $2 billion investment announced in March. The news signals deeper strategic alignment in AI cloud infrastructure.
Is the daily MACD for NBIS bullish or bearish?
Bearish. The MACD line at -13.65 sits well below the signal line at -6.80. The histogram at -6.85 is widening, confirming sellers remain in control on the daily timeframe.
What needs to happen for Nebius Stock to turn bullish?
NBIS must reclaim and hold above the daily pivot at $185.35. A subsequent push above the hourly EMA50 at $193.54 and ultimately the daily EMA20 near $212 would be needed to shift the broader trend.
Disclaimer: This article is for informational purposes only and does not constitute financial advice, an investment recommendation, or a solicitation to buy or sell any financial instrument or cryptocurrency. The analysis provided is not indicative of future results. Investing in crypto assets and financial markets carries a high risk of capital loss. Always do your own research (DYOR) and consult a qualified financial advisor before making any decision.
Article produced with the assistance of artificial intelligence and reviewed by the editorial team.
