




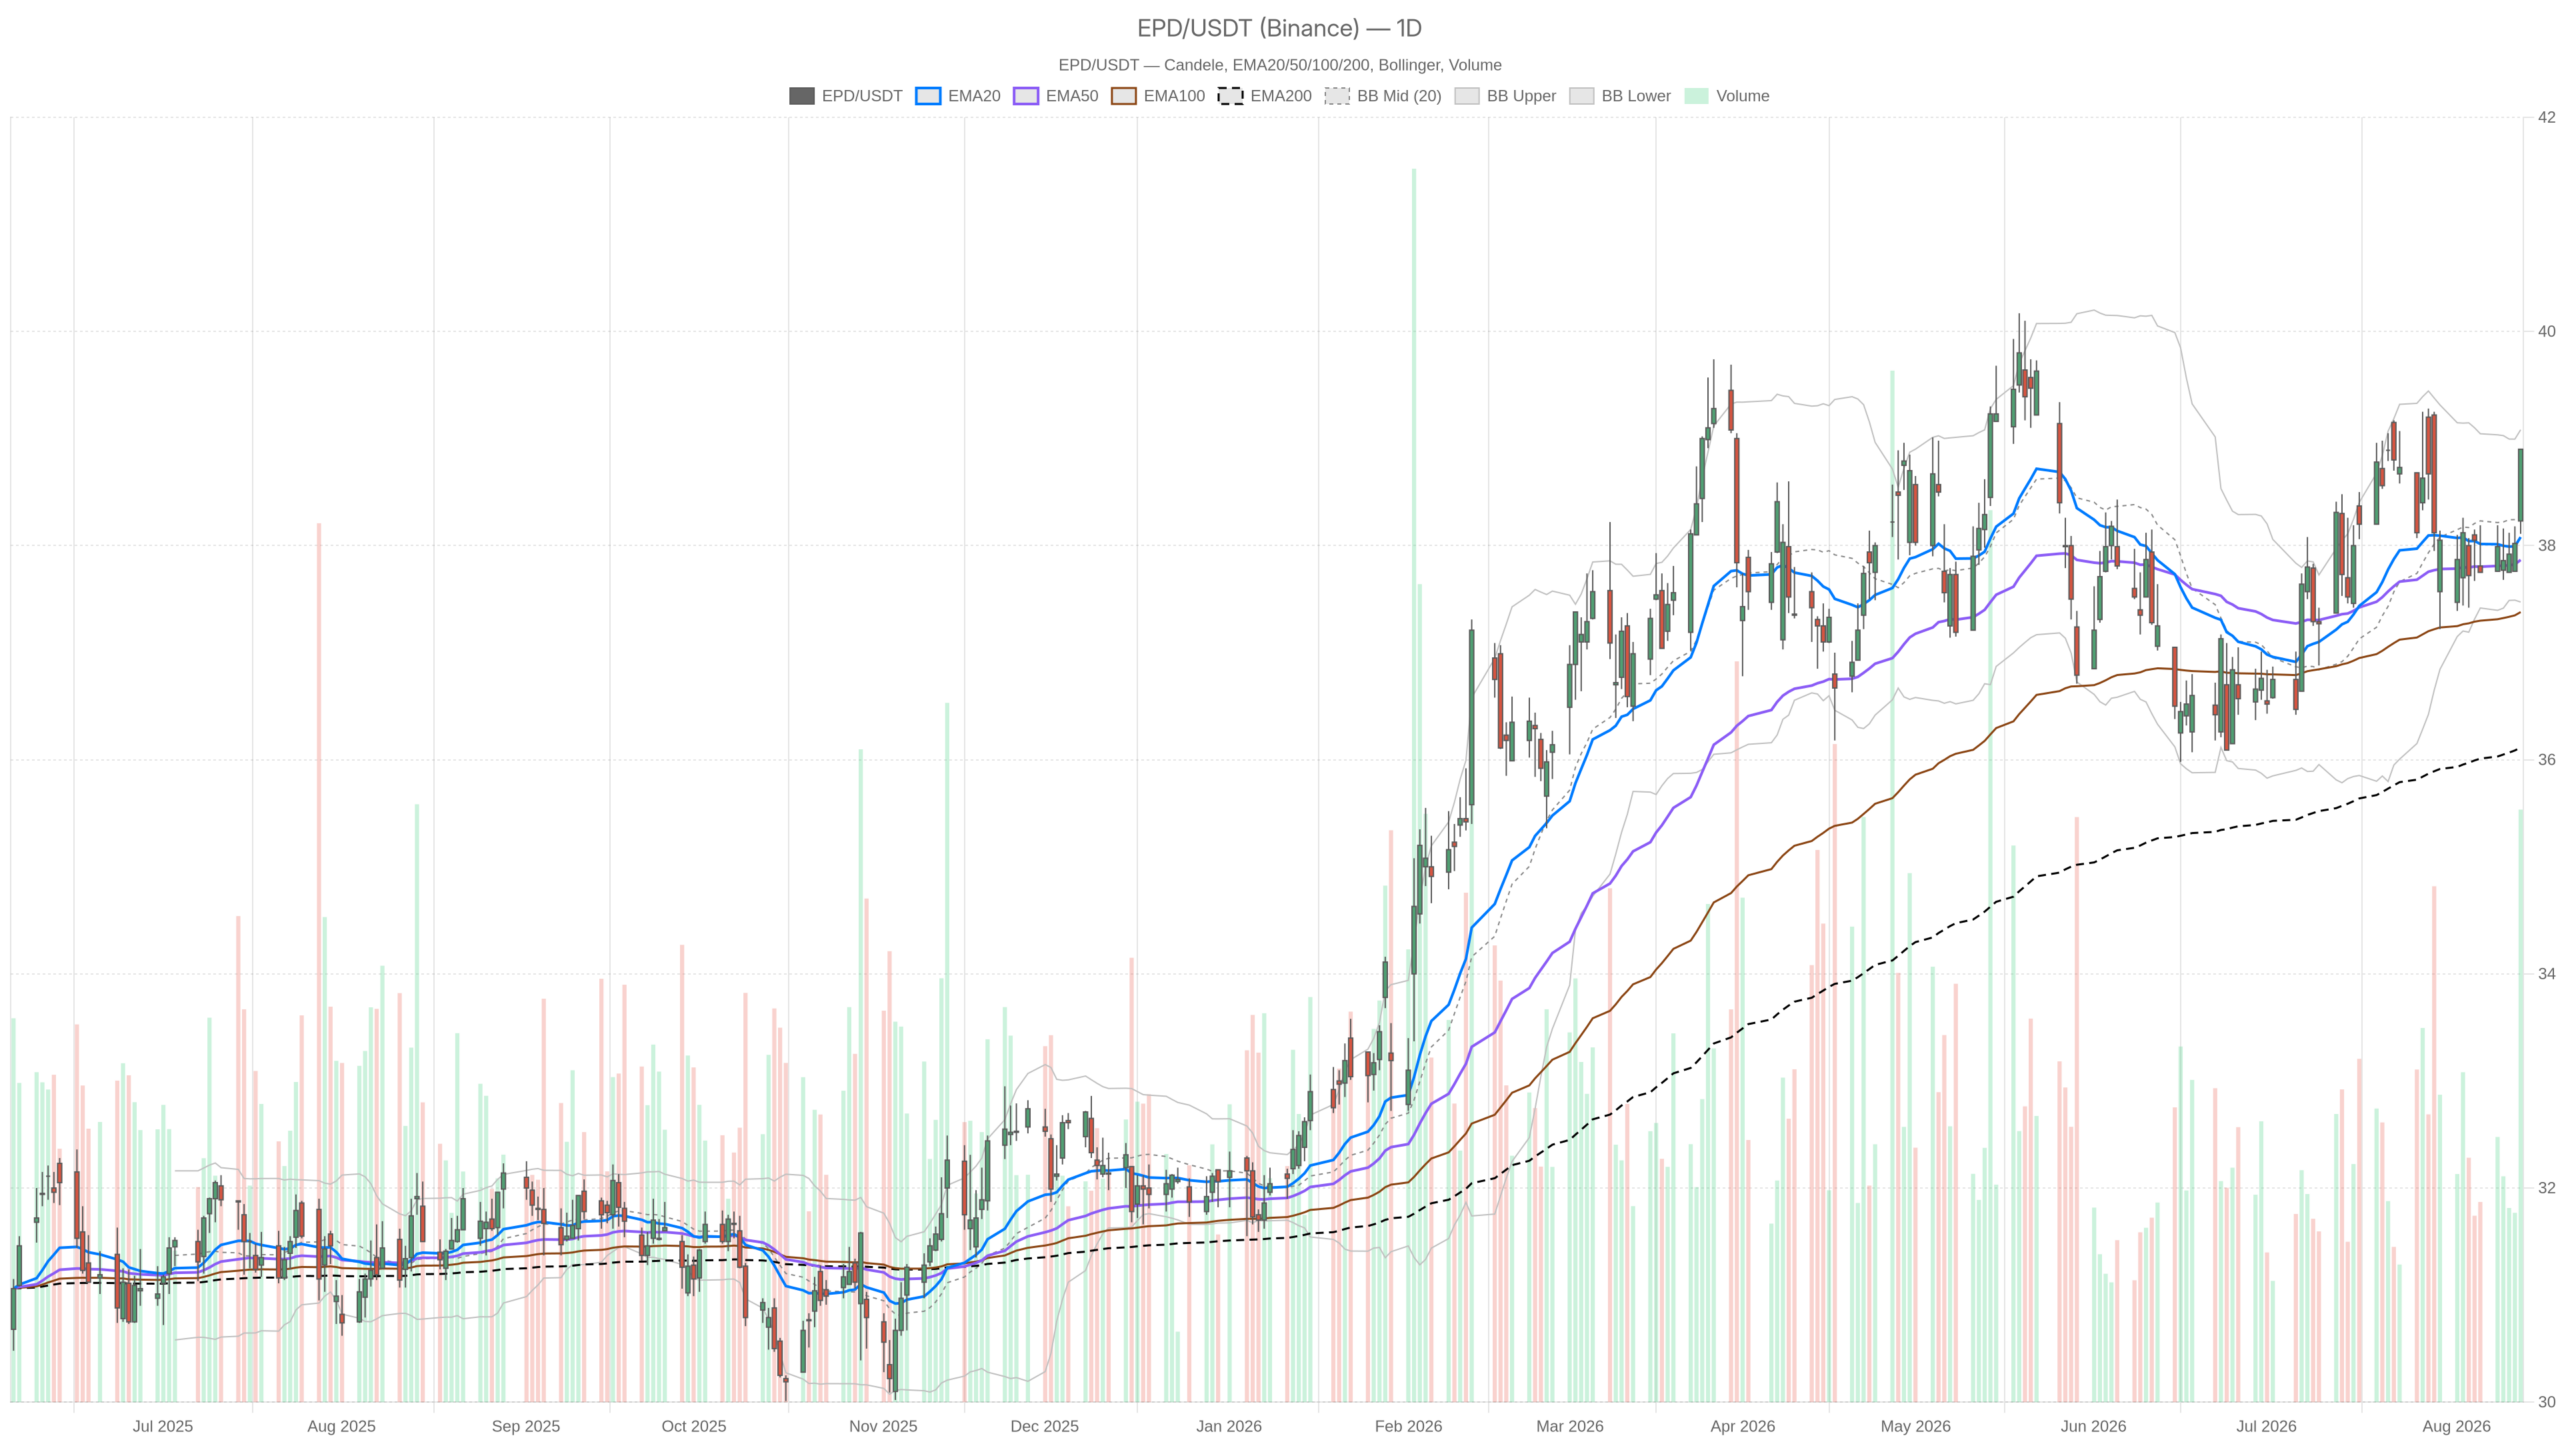
Enterprise Products Partners L. stock closed at $38.90 on August 14, printing a fresh session high above all three key moving averages. The daily structure remains firmly bullish. However, lower-timeframe charts show momentum stretched into overbought territory, creating tension between the broader uptrend and short-term exhaustion risk.
Summary
Key takeaways
- EPD stock closed at $38.90, trading above EMA20 ($38.08), EMA50 ($37.87), and EMA200 ($36.11)
- Daily RSI at 60.48 remains constructive with further room to run before signaling exhaustion
- 1-hour RSI at 76.31 and 15-minute RSI at 79.96 both signal overbought conditions
- Daily MACD histogram sits at zero, indicating flattening momentum despite new highs being printed
- Key resistance stands at $39.16 (R1); critical support rests at $38.37 (S1) and $38.08 (EMA20)
Daily Structure Confirms Bullish Regime for EPD Stock
Moving Average Stack Anchors the Uptrend
The regime indicator flags the daily trend as bullish, with price action backing that assessment. The session high of $38.90 sits just below the daily Bollinger upper band at $39.08, while the midline rests at $38.28. RSI14 on this timeframe reads 60.48, a level reflecting constructive buying interest without tipping into overbought territory. Unlike the lower timeframes, the daily RSI still has room to run before flashing exhaustion.
Momentum Flattens as Price Climbs
The daily MACD, however, tells a more cautious story. The MACD line sits at 0.11, essentially matched with the signal line at 0.11, producing a histogram value of zero. This means daily momentum has flattened rather than accelerated, even as price pushes to new highs. Meanwhile, the ATR14 of 0.71 confirms that daily volatility remains moderate—neither compressed nor spiking—consistent with a trending market rather than a choppy one.
Pivot levels place the pivot point at $38.64, with resistance at R1 $39.16 and support at S1 $38.37. Since price already trades above the pivot, the near-term bias favors a test of R1. Still, the flattening MACD histogram suggests that move may lack conviction unless fresh volume steps in.
1-Hour Chart: Uptrend Confirmed, Overbought Warning Active
The 1-hour chart confirms the daily bullish regime through its own EMA stack. EMA20 sits at $38.33, EMA50 at $38.14, and EMA200 at $37.94—all stacked in bullish order beneath the current price. The MACD line reads 0.21 against a signal of 0.13, generating a positive histogram of 0.08 and showing that momentum is still expanding on an hourly basis.
On the other hand, RSI14 on the 1-hour chart has climbed to 76.31, a clearly overbought reading. At the same time, price at $38.90 trades above the 1-hour Bollinger upper band of $38.85. This combination often signals a short-term stretch rather than a sustainable breakout pace. Therefore, while the hourly trend direction agrees with the daily bias, its momentum readings warn the move has outpaced typical mean-reversion tolerances.
The 1-hour pivot data reinforces this near-term tightness: pivot at $38.83, R1 at $38.97, and S1 at $38.76. Price hugs the upper end of that range, leaving limited room before either a breakout toward R1 or a retreat back toward the pivot.
15-Minute Execution Context: Overextension Deepens
Zooming into the 15-minute chart, the overbought signature becomes even more pronounced. RSI14 here sits at 79.96, the most extended reading across all three timeframes. The MACD line at 0.14 versus a signal of 0.13 produces a thin histogram of just 0.01, indicating that intraday momentum is losing steam even as price holds near its highs.
Notably, the 15-minute Bollinger bands show price at $38.90 trading above the upper band of $38.86, with the midline at $38.61. This is a classic short-term overextension pattern. The tight ATR14 of 0.07 confirms that recent price action has compressed, which often precedes a volatility burst once the micro-range resolves. For traders using this chart purely for timing entries, the message is caution around chasing the current candle—not a signal to fade the broader trend.
Bullish Scenario: Path Toward $39.16
The bullish case for Enterprise Products Partners L. stock rests on the daily EMA structure holding firm. The shares must clear the daily R1 level at $39.16. A sustained close above that resistance would suggest the current flattening in momentum was only a pause within a larger uptrend—especially if the MACD histogram turns positive again on the daily chart. In that scenario, a shallow pullback toward the 1-hour EMA20 near $38.33 could offer a healthier entry point before continuation. A retest of the 15-minute pivot support at $38.80 presents a similar opportunity.
Bearish Scenario: Corrective Risks From Overbought Levels
In contrast, the bearish risk centers on overbought readings across the 1-hour and 15-minute charts resolving through a deeper corrective move. A break below the daily S1 at $38.37 would weaken the near-term bullish structure. A close under the daily EMA20 at $38.08 would add further pressure. Should the daily MACD histogram turn negative from its current flat reading, that would serve as an early warning. It would signal the broader trend is losing underlying strength rather than simply pausing.
Closing Take on Enterprise Products Partners L. Stock
Overall, the daily timeframe still favors the bulls. EPD stock trades above every major moving average, and RSI holds a constructive, non-extreme level. At the same time, the 1-hour and 15-minute charts flash clear overbought signals. RSI readings above 76 and 79, combined with price stretched beyond upper Bollinger bands on both timeframes, point to short-term exhaustion. This is a case where the higher timeframe trend and lower timeframe momentum are not fully aligned. Positioning around current levels therefore calls for patience. A short-term cooling-off period would not contradict the broader bullish structure. Given the tight ATR readings on intraday charts, volatility could expand quickly once the current stretch resolves. Traders should weigh that uncertainty carefully against the still-intact daily trend.
FAQ
Is Enterprise Products Partners L. stock still in a bullish trend?
Yes. The daily chart shows EPD stock trading above all three key moving averages—EMA20 at $38.08, EMA50 at $37.87, and EMA200 at $36.11. The regime indicator confirms a bullish structure, and daily RSI at 60.48 remains constructive without reaching overbought levels.
What are the key support and resistance levels for EPD stock?
Key resistance stands at $39.16 (daily R1), with the daily Bollinger upper band at $39.08 providing additional overhead. On the support side, daily S1 sits at $38.37, with the EMA20 at $38.08 acting as critical trend support that would need to hold for the bullish structure to remain intact.
What does the overbought RSI mean for EPD’s short-term outlook?
The 1-hour RSI at 76.31 and 15-minute RSI at 79.96 both signal that buying momentum has stretched beyond typical levels. This does not negate the broader bullish trend, but it does suggest a pause or shallow pullback may be needed before the next leg higher can develop with conviction.
Should traders buy Enterprise Products Partners L. stock at current levels?
The daily trend remains bullish, but the intraday charts warn against chasing the current price. A pullback toward the 1-hour EMA20 near $38.33 or the 15-minute pivot support at $38.80 would present lower-risk entry points aligned with the broader uptrend. Patience is warranted until the short-term overbought conditions ease.
Disclaimer: This article is for informational purposes only and does not constitute financial advice, an investment recommendation, or a solicitation to buy or sell any financial instrument or cryptocurrency. The analysis provided is not indicative of future results. Investing in crypto assets and financial markets carries a high risk of capital loss. Always do your own research (DYOR) and consult a qualified financial advisor before making any decision.
Article produced with the assistance of artificial intelligence and reviewed by the editorial team.
