




WhiteFiber stock closed Tuesday at $27.07, down from a $28.72 open, as a 30-year Treasury yield spike near 5.274% rattled equities. WYFI held above daily support, keeping its longer-term trend intact despite the bond-driven selloff.
Summary
Key takeaways
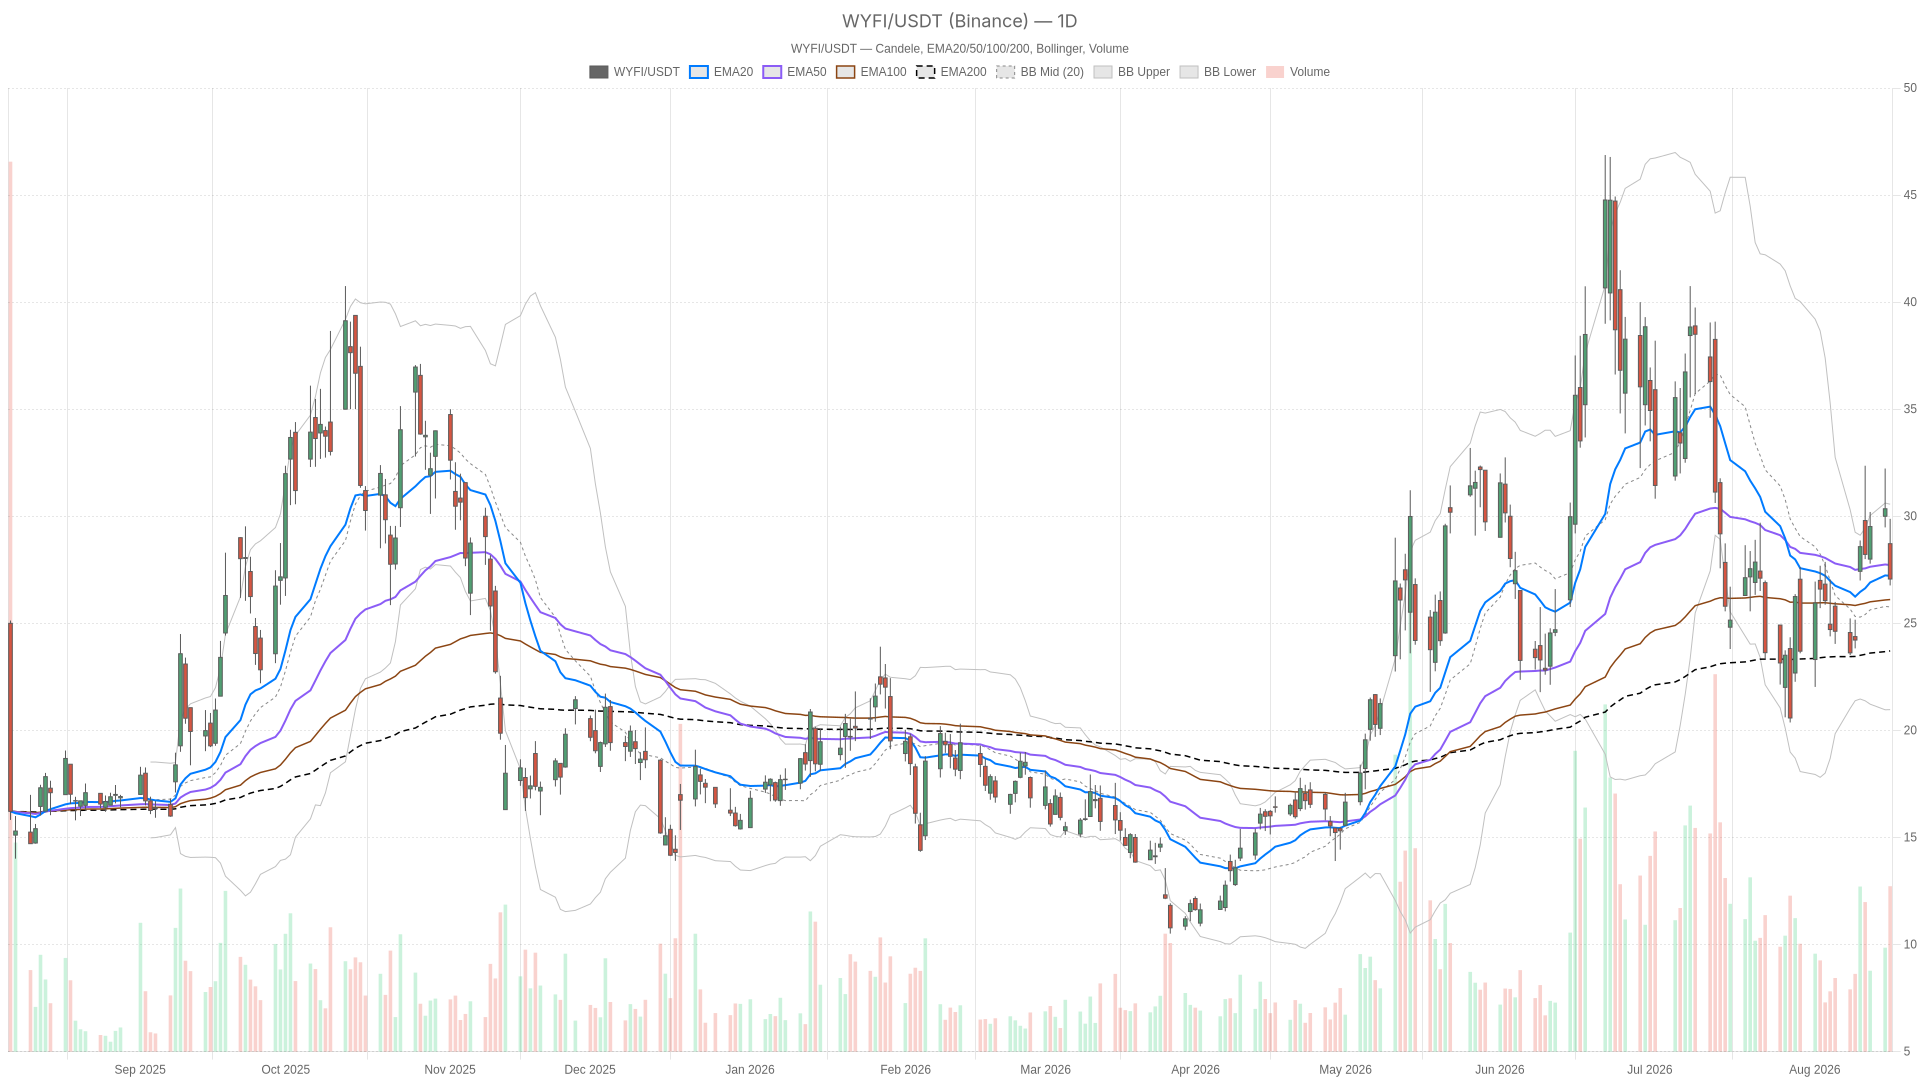
- WhiteFiber stock closed at $27.07 on Tuesday, below its 20-day EMA of 27.22 but well above the 200-day EMA of 23.71.
- The daily MACD histogram turned positive at 0.7, pointing to fading downside momentum.
- Daily support sits at 25.93 (S1), while the daily pivot at 27.91 frames the immediate range.
- Needham reiterated a Buy rating on August 13, citing cloud growth and $28.8 million in reported revenue growth.
WhiteFiber Stock Daily Momentum Shows Stabilization
WhiteFiber stock’s daily momentum is stabilizing despite the sharp Tuesday pullback. The close at $27.07 sits just below the 20-day EMA (27.22) and the 50-day EMA (27.72). Yet it remains well above the 200-day EMA at 23.71, which still frames the broader trend as constructive.
The daily RSI at 49.03 sits essentially neutral, still offering no strong directional signal on its own. More telling is the MACD. The line at -0.33 has crossed above the signal at -1.03, producing a positive histogram reading of 0.7.
Both readings remain below zero, so broader daily momentum is still negative overall. Still, the crossover suggests the selling pressure behind the recent decline is starting to fade. This is not a reversal signal yet, but it is a stabilization signal.
Bollinger Bands and Pivot Levels Frame the Range
Meanwhile, daily Bollinger Bands place Tuesday’s close in a non-stretched zone. For context, the mid-line sits at 25.77, with the upper band at 30.56 and the lower band at 20.97. At $27.07, price sits comfortably between the mid and upper band.
The daily ATR of 3.17 confirms an unusually volatile session relative to typical ranges. Notably, the daily pivot point sits at 27.91, with resistance at 29.04 (R1) and support at 25.93 (S1). A close at 27.07 places WYFI in a contested middle zone rather than at a clean breakdown or breakout point.
Intraday Timeframes Lean Bearish on WYFI
In contrast, the hourly timeframe remains bearish for WhiteFiber stock. Price at 27.05 trades below the 20-EMA (28.50), 50-EMA (27.97) and 200-EMA (28.32). That forms a fully bearish EMA stack for the near term.
The hourly RSI at 38.40 leans toward weakness without reaching oversold extremes. Meanwhile, the MACD line (-0.31) sits below its signal (0.20), producing a negative histogram of -0.51. That combination confirms active intraday selling pressure and complicates the tentative daily stabilization.
In other words, the daily chart hints at fading downside momentum while the hourly chart remains actively bearish. Therefore, this clear conflict between timeframes deserves respect rather than being ignored.
The hourly Bollinger setup reinforces the picture. With the mid-band at 29.22 and the lower band at 25.95, price near 27.05 trades closer to the lower half of the range. Notably, the hourly pivot point sits at 27.01, almost exactly where price is trading, making this level an immediate battleground for direction.
15-Minute Chart Shows Volatility Compression
At the same time, the 15-minute chart keeps the short-term bias tilted lower. Price at 27.05 remains below its 20-EMA (27.43), 50-EMA (28.33) and 200-EMA (27.95). The 15m RSI at 29.69 is approaching oversold territory.
The 15m MACD histogram has ticked up slightly to 0.12 from a still-negative line and signal (-0.51 and -0.63, respectively). That small improvement suggests short-term selling may be losing intensity, echoing the daily MACD signal even as the broader 15m trend stays soft.
Bollinger Bands here are notably tight, with the upper band at 27.29 and lower band at 26.93. The 15m ATR of just 0.30 reflects clear volatility compression that often precedes a directional move. The 15m pivot at 27.02 aligns closely with the hourly pivot, reinforcing this zone as the key short-term decision point.
Fundamental Backdrop Supports WhiteFiber Stock
The fundamental case for WhiteFiber stock is not without support. Needham reiterated a Buy rating on August 13, citing cloud growth. In addition, the company’s Q2 2026 earnings call detailed $28.8 million in revenue growth alongside major GPU deployment agreements, according to CEO Tabar.
This narrative — AI infrastructure demand and cloud-driven revenue expansion — remains the core bullish case for WYFI stock independent of recent macro-driven volatility.
Bullish and Bearish Scenarios for WYFI
A bullish scenario requires WYFI to hold above the daily S1 support at 25.93 and reclaim the daily 20-EMA near 27.22. A move back above the 50-EMA at 27.72 would follow. Confirmation would come from the daily MACD histogram continuing to expand and the hourly EMA stack flipping from bearish to neutral or bullish.
Renewed buying interest tied to the Needham Buy rating and reported revenue growth could provide the fundamental spark. This becomes more likely if bond-yield pressure eases and risk appetite for AI infrastructure names improves.
On the other hand, a bearish scenario centers on failing to defend the current pivot zone. A break below the daily S1 at 25.93 would open the door toward the daily lower Bollinger Band near 20.97. This risk rises if the bond-market rout intensifies and yields push further into multi-year-high territory.
Continued weakness in the hourly RSI below 38, alongside a persistently bearish hourly EMA stack, would invalidate the tentative daily stabilization. It would confirm that sellers remain in control across timeframes.
Overall Outlook for WhiteFiber Stock
Overall, WhiteFiber stock is caught between a still-intact longer-term uptrend and a fragile near-term tape shaken by a broader bond-market shock. The daily chart shows early signs of momentum stabilizing. The hourly and 15-minute timeframes, however, remain tilted bearish.
This creates a genuine cross-timeframe conflict rather than a clean directional signal. With volatility elevated — as reflected in the daily ATR — and price compressed near key pivot levels, positioning here calls for caution. The coming sessions, and how WYFI behaves around the 25.93–27.91 daily range, should clarify whether the AI infrastructure growth story can reassert itself.
FAQ
What is the key support level for WhiteFiber stock?
The daily S1 support sits at 25.93. A break below that level would open the door toward the daily lower Bollinger Band near 20.97.
Is the longer-term trend for WYFI still intact?
Yes. WhiteFiber stock closed at $27.07, well above the 200-day EMA at 23.71, which still frames the broader trend as constructive.
What did Needham say about WhiteFiber stock?
Needham reiterated a Buy rating on August 13, citing cloud growth. The company’s Q2 2026 earnings call also detailed $28.8 million in revenue growth alongside GPU deployment agreements.
What would confirm a bullish reversal for WYFI?
A bullish scenario requires holding above 25.93, reclaiming the 20-day EMA near 27.22, and moving back above the 50-EMA at 27.72, with the daily MACD histogram continuing to expand.
Disclaimer: This article is for informational purposes only and does not constitute financial advice, an investment recommendation, or a solicitation to buy or sell any financial instrument or cryptocurrency. The analysis provided is not indicative of future results. Investing in crypto assets and financial markets carries a high risk of capital loss. Always do your own research (DYOR) and consult a qualified financial advisor before making any decision.
Article produced with the assistance of artificial intelligence and reviewed by the editorial team.
