




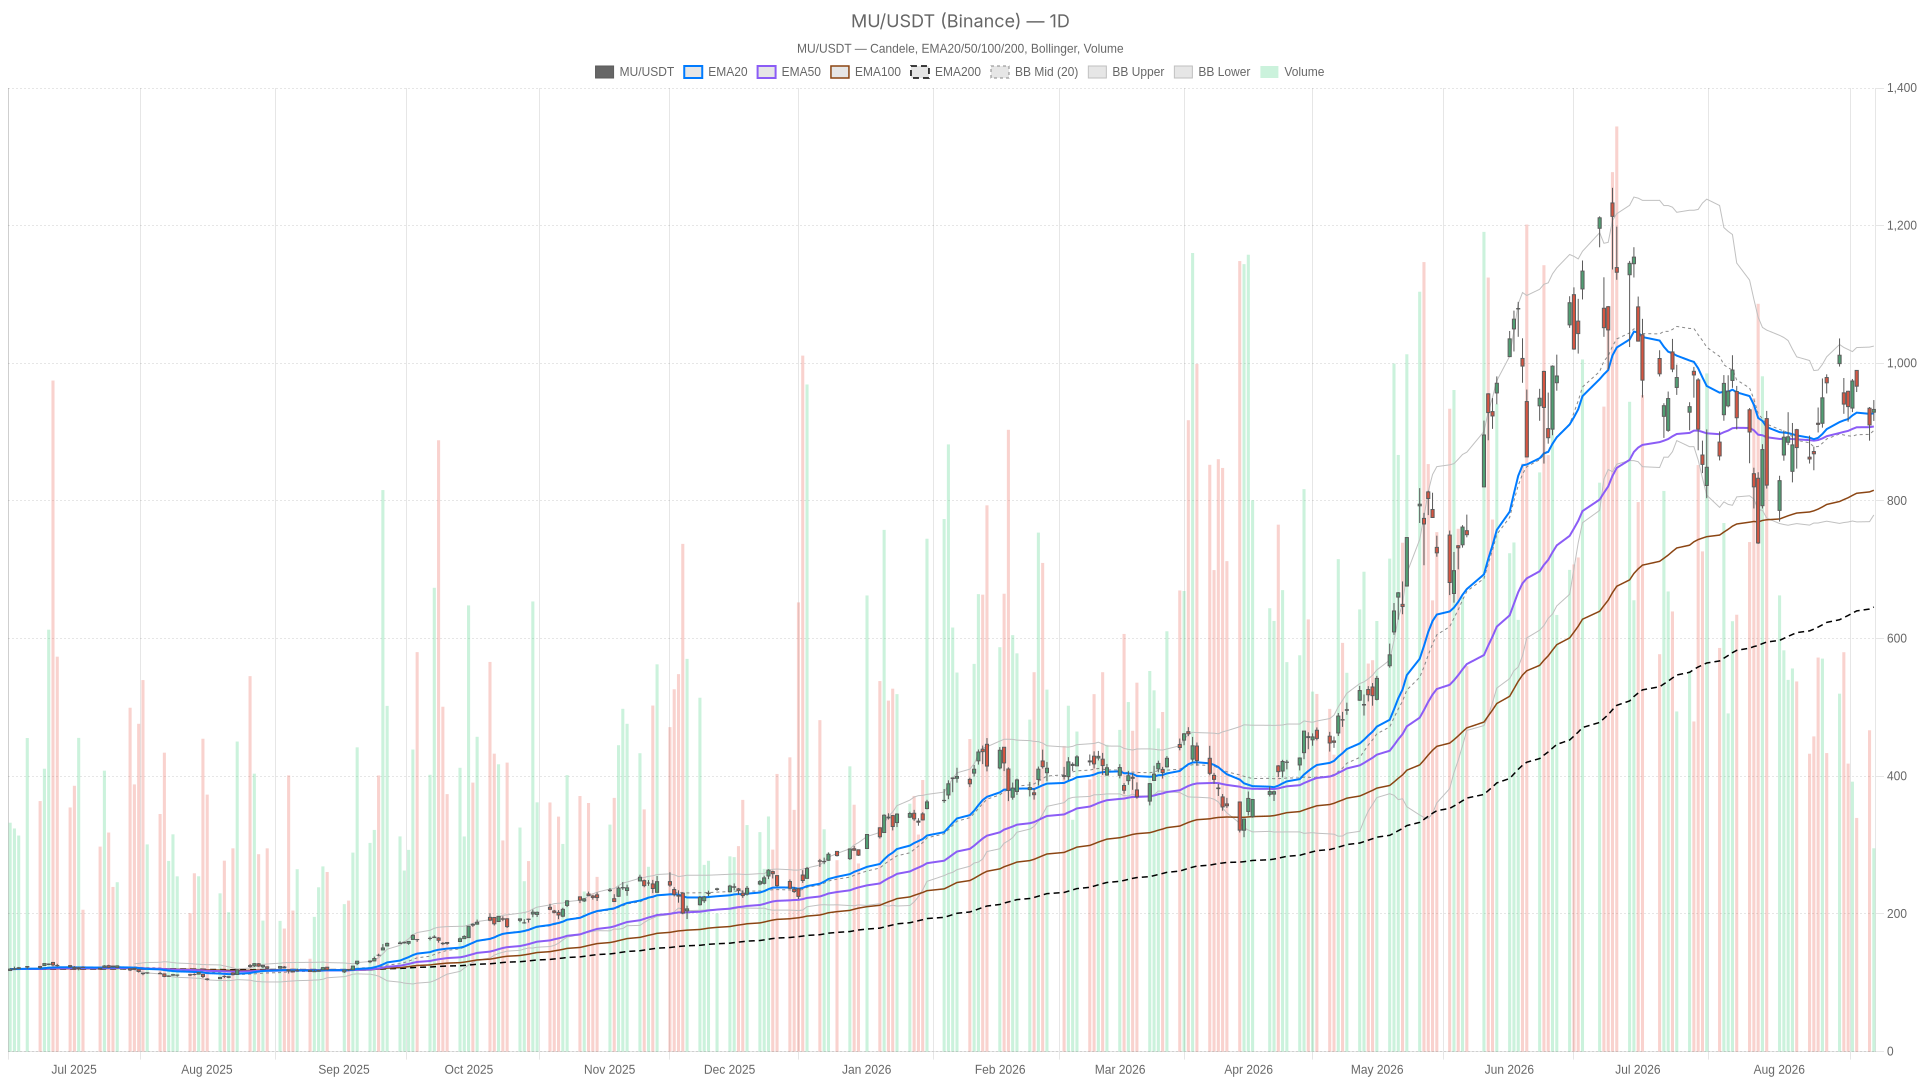
Micron stock is walking a tightrope between a powerful primary uptrend and a short-term pause. Shares closed at $932.97, recovering from a sharp -5.83% drop to $910.43 the prior session. That swing shows how reactive this tape has become even as the broader structure stays tilted bullish.
Summary
Key takeaways
- Micron stock closed at $932.97, rebounding after a -5.83% decline to $910.43 in the prior session.
- The daily chart remains bullish, with price above the EMA20 at 927.22, the EMA50 at 908.23, and the EMA200 at 645.87.
- The hourly chart is neutral, with MU below the EMA50 at 937.40 and the EMA200 at 938.27.
- Daily ATR14 sits at 55.84, signaling elevated volatility ahead of Nvidia’s earnings.
- Bullish confirmation requires a reclaim of 937-938 and a push above resistance at 947.63.
Is the Daily Trend Still Bullish for Micron Stock?
Yes. Micron stock’s daily chart remains explicitly bullish, and the moving average stack confirms that bias. Price holds above both the EMA20 and the EMA50, far above the longer-term average.
Moving Average Structure
Price sits above the EMA20 at 927.22 and the EMA50 at 908.23. Both sit far above the EMA200 at 645.87. That separation reflects the scale of Micron’s rally over the past year, not a fresh breakout.
Momentum and Volatility Context
Momentum confirms the picture without screaming exhaustion. The MACD line at 7.91 remains above its signal at 2.59, with a histogram of 5.32 that is still expanding. RSI14, however, reads a calm 50.78, essentially neutral.
That combination matters. The trend is up, momentum is positive, and the stock is not technically overbought. At the same time, volatility remains elevated. Bollinger Bands are wide, with the mid-band at 902.38 flanked by an upper band at 1025.06 and a lower band at 779.69.
Notably, ATR14 sits at 55.84, meaning daily swings of several percentage points are now the norm. The daily pivot at 931.96 sits almost exactly where price closed. Resistance at 947.63 sits near the session high of 946.62. Support at 917.31 sits close to the day’s low of 916.3.
What Does the Hourly Chart Say About MU?
The hourly chart tells a more cautious story. MU sits in neutral consolidation and has not yet confirmed the daily uptrend.
Price at 932.59 sits just below the EMA20 at 931.58, but still under the EMA50 at 937.40 and the EMA200 at 938.27. In other words, the shorter-term moving averages have not confirmed the daily uptrend. They are still stacked slightly bearish above current price.
The hourly MACD tells a similar story of stabilization rather than strength. The line sits at -6.36 against a signal of -7.56, still negative overall. The histogram at 1.2 shows the gap is narrowing. Meanwhile, hourly RSI14 at 49.08 is flat, offering no directional conviction either way.
Taken together, this looks like a market catching its breath after the prior day’s sharp decline. It is not yet resuming its climb with force. Therefore, the daily and hourly timeframes are not fully aligned. The bigger trend remains up. Still, the hourly structure needs to reclaim its EMA50 and EMA200 near 937-938 before the bullish daily thesis gets real short-term confirmation.
How Should Traders Read the 15-Minute Chart?
The 15-minute chart is also neutral, but its momentum leans mildly constructive. Short-term buyers appear active.
RSI14 at 59.25 and a small positive MACD histogram of 0.43 support that view. Price is pressing against the upper Bollinger band at 933.71, with the mid-band at 927.25 acting as a nearby reference. In turn, the intraday pivot at 930.63 frames the range. Resistance sits at 936.27, while support rests at 926.96. These levels mirror the hourly structure almost exactly.
What Would Confirm the Bullish Micron Stock Case?
Two conditions would confirm the bullish case for Micron stock. The hourly chart must reclaim the 937-938 zone, and price must push above daily resistance at 947.63.
Meanwhile, the fundamental backdrop still favors Micron stock. Goldman Sachs has flagged a memory supply crunch tightening toward levels not seen since 2017. Micron has reportedly locked in contracts positioned to benefit from that scarcity. Reports also note Micron has surged roughly 675% over the past year as a key memory supplier to Nvidia. Nvidia’s upcoming earnings report is seen as a potential catalyst that could push shares toward four-digit territory.
Technically, the bullish scenario needs confirmation. The hourly chart must reclaim the EMA50 and EMA200 near 937-938. A daily close above the pivot at 931.96, followed by a push through resistance at 947.63, would align both timeframes. Combined with a supportive Nvidia guidance print, that would give bulls a clean technical and fundamental case.
What Could Invalidate the Bullish Micron Stock Thesis?
The bullish thesis weakens if Micron stock fails to hold the daily EMA20 near 927.22 and the pivot at 931.96. That would open the door to lower support.
On the other hand, the bearish risk is not trivial. One widely discussed question is whether it is too late to buy Micron stock after a reported 981% surge. Some analysts point to a strong margin profile that may leave little room for further exponential earnings growth. That valuation concern is exactly the kind of narrative that can trigger profit-taking on disappointing news.
Technically, a failure to hold the daily EMA20 at 927.22 and the pivot at 931.96 would open the door toward support at 917.31. Ultimately, that path leads toward the EMA50 at 908.23, the first real trend-defining level below current price. The prior session’s -5.83% single-day drop is a reminder of how quickly sentiment can turn in this name. If Nvidia’s guidance disappoints this week, that combination of stretched valuation and hourly weakness could accelerate a deeper pullback rather than a shallow dip.
Closing Take on Micron Stock
Overall, the daily chart still belongs to the bulls. Trend, moving averages, and MACD all point the same direction for Micron stock.
In contrast, the hourly picture is more cautious. MU sits in consolidation below its key moving averages after a volatile prior session. That divergence between timeframes, paired with an ATR14 of 55.84, raises the stakes. Position sizing and risk management matter more than usual right now. With Nvidia’s earnings looming as a binary catalyst and the memory shortage narrative still intact, uncertainty around Micron stock is elevated in both directions. Traders should treat the coming sessions as a genuine test of whether the daily uptrend can absorb the shorter-term hesitation.
FAQ
Is Micron stock still in a bullish trend?
Yes. On the daily chart, Micron stock remains bullish, holding above the EMA20 at 927.22 and the EMA50 at 908.23, with a positive MACD.
What level must MU reclaim on the hourly chart?
MU needs to reclaim the 937-938 zone, where the hourly EMA50 at 937.40 and EMA200 at 938.27 currently sit, to confirm the daily uptrend.
What could trigger a deeper pullback in Micron stock?
Disappointing Nvidia guidance, combined with a failure to hold 931.96 and 927.22, could push price toward 917.31 and then the EMA50 at 908.23.
Why is volatility elevated in MU right now?
Daily ATR14 sits at 55.84, Bollinger Bands are wide, and the prior session produced a -5.83% single-day drop.
Disclaimer: This article is for informational purposes only and does not constitute financial advice, an investment recommendation, or a solicitation to buy or sell any financial instrument or cryptocurrency. The analysis provided is not indicative of future results. Investing in crypto assets and financial markets carries a high risk of capital loss. Always do your own research (DYOR) and consult a qualified financial advisor before making any decision.
Article produced with the assistance of artificial intelligence and reviewed by the editorial team.
