




Nvidia stock is trading near $213 in a tight, indecisive range ahead of a closely watched earnings report. Daily structure shows a stalled stock, while intraday charts hint at stabilization. With guidance reportedly near $91 billion in revenue, bulls look toward $325 and bears brace for a stall.
Summary
Key takeaways
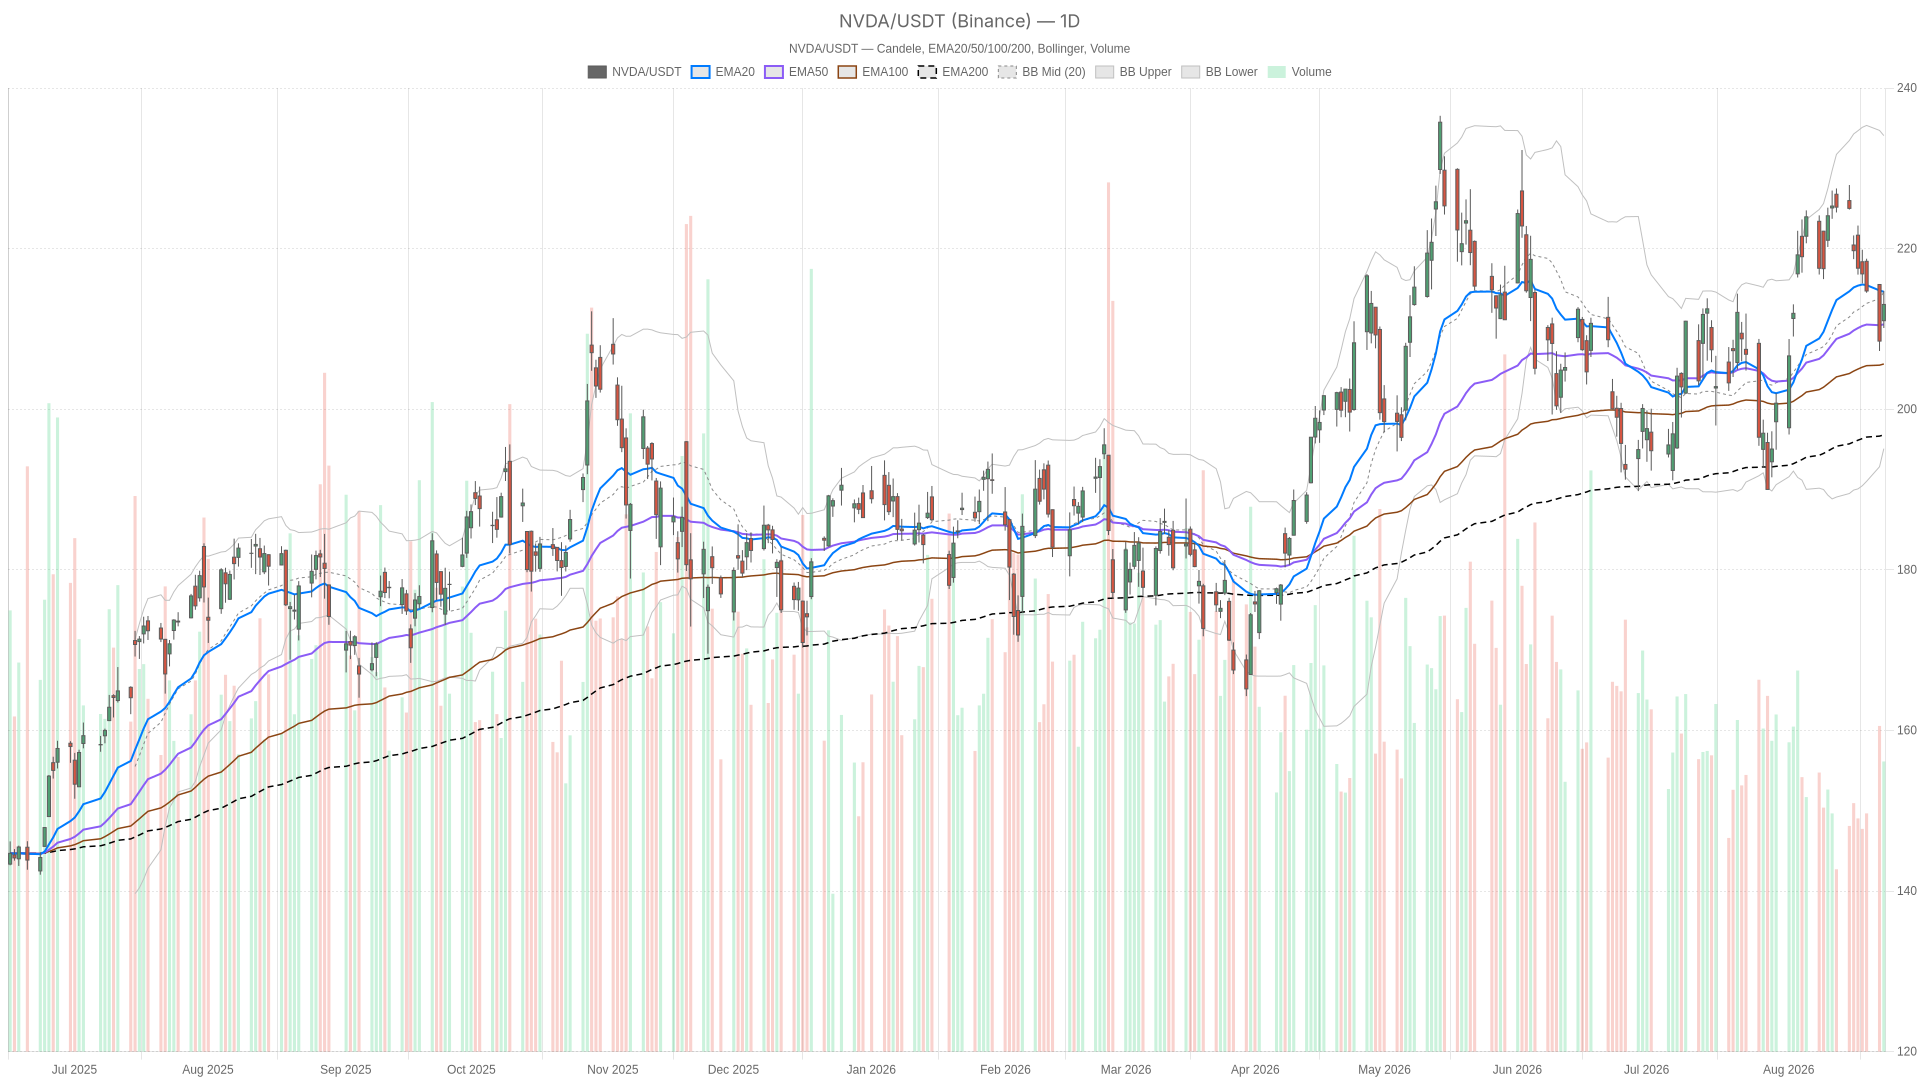
- NVDA closed at $213.05 on the daily chart, within a range of $210.11 to $214.73.
- Price sits below the 20-day EMA at $214.62 but above the 50-day EMA at $210.56 and the 200-day EMA at $196.81.
- The daily RSI at 49.61 and a negative MACD histogram of -1.26 signal neutral, fading momentum.
- Jensen Huang reportedly guided toward $91 billion in revenue.
- Analysts debate whether Nvidia stock can break toward $325 or stall out entirely.
Daily Trend: Cooling Momentum in Nvidia Stock’s Long-Term Uptrend
Nvidia stock’s long-term uptrend remains intact, but short-term momentum has cooled to neutral. NVDA closed at $213.05 on the daily chart, after a range between $210.11 and $214.73.
Still, price sits just below the 20-day EMA at $214.62. It holds comfortably above the 50-day EMA at $210.56 and far above the 200-day EMA at $196.81. That layered structure shows the broader uptrend is intact. Yet short-term momentum has softened enough to pull price toward the middle of its recent range.
The daily RSI at 49.61 confirms this neutrality. It is neither overbought nor oversold. This reflects a market that has lost directional conviction rather than one preparing an aggressive move.
Meanwhile, the daily MACD paints a more cautious picture. The MACD line sits at 2.19, below its signal line at 3.46, producing a negative histogram of -1.26. That is a classic sign of fading bullish momentum. It matches the news flow describing Nvidia’s growth supercycle as stalling after three years of blockbuster returns.
Bollinger Bands add context on volatility. The daily mid-band at 214.58 is essentially where price is consolidating. The upper band at 234.07 and lower band at 195.09 show that NVDA is nowhere near an extreme in either direction.
The daily ATR of 5.6 confirms this is a market breathing normally, not stretching. Pivot levels reinforce the same message. The daily pivot point sits at 212.63, with resistance at 215.15 and support at 210.53, both closely clustered around current price.
In short, the daily regime is officially neutral. Price is compressing right at the pivot ahead of the catalyst.
Hourly Chart: A Fragile Attempt to Stabilize
In contrast, Nvidia stock is trying to stabilize on the hourly chart, but the recovery remains fragile. Price closed at 212.98, above the 20-hour EMA at 212.70 and the 200-hour EMA at 212.69. Still, it sits below the 50-hour EMA at 215.47.
That mixed EMA alignment shows a market trying to find footing after a pullback. It has not yet reclaimed the medium-term hourly trend.
Notably, the hourly MACD tells a more encouraging short-term story than the daily. The MACD line at -1.38 remains below its signal at -1.91, but the histogram has turned positive at 0.53. This suggests downside momentum is fading on this timeframe.
The hourly RSI at 47.8 is still neutral. It is not yet confirming a strong reversal, but it is no longer trending lower either. Bollinger Bands show price near the mid-band at 212.19. The upper band sits at 216.85 and the lower band at 207.52, again pointing to a market without extreme positioning.
The hourly ATR of 2.41 is modest. Price is holding right at the hourly pivot of 212.70, with resistance at 213.51 and support at 212.17.
Therefore, the hourly picture partially conflicts with the daily one. While the daily MACD shows fading bullish momentum, the hourly MACD shows early signs of stabilization. This is not a full reversal signal. Still, it suggests buyers are defending this zone in the short term, even as the broader daily trend remains undecided.
15-Minute View: Execution Context Into Earnings
Nvidia stock shows a mild bullish tilt on the 15-minute chart, but this is only execution-level context. Price closed at 212.98, above the 20-period and 50-period EMAs aligned at 212.14. It remains below the 200-period EMA at 215.92.
The 15-minute RSI at 58.61 shows a mild bullish tilt intraday. The MACD histogram is only marginally positive at 0.03. In other words, momentum here is about short-term positioning rather than conviction.
Price is trading near the upper Bollinger band at 213.31, close to the pivot resistance of 213.40. The 15-minute ATR is just 0.87. Traders are watching whether price can hold above the pivot at 212.81 into the earnings release. They are not establishing any new trend.
Bullish Scenario for Nvidia Stock
Nvidia stock’s bullish case requires reclaiming key resistance and confirming a momentum shift. Price would likely need to move back above the 20-day EMA at 214.62. It would also need to push through the daily pivot resistance at 215.15.
Confirmation would come from the hourly MACD histogram continuing to expand positively. RSI readings across timeframes would also need to move convincingly above 50.
Fundamentally, the bulls’ case is reinforced by Jensen Huang’s guidance toward $91 billion in revenue. Commentary suggests the stock could break toward $325 if the report satisfies elevated expectations. A strong earnings beat could reignite the momentum that drove NVDA through the earlier AI boom. Reassurance on the custom silicon competitive threat from customers like OpenAI, Google, and Amazon would also be needed.
Bearish Scenario and What Would Invalidate the Bullish Case
Nvidia stock’s bearish case hinges on a failure to hold pivot support and a sustained loss of momentum. The daily MACD’s negative histogram and the stock’s inability to reclaim its 20-day EMA are the core warning signs.
On the other hand, a failure to hold the daily pivot at 212.63 would signal a deeper stall. A break below daily support at 210.53 would confirm that shift. This would align with reporting that insiders have been selling and that returns have been average compared to Nvidia’s earlier supercycle years.
A disappointing earnings reaction, however, could accelerate downside pressure. Renewed concern about competitors developing their own custom silicon would add to that pressure. This could push price toward the lower Bollinger band near $195.09 on the daily chart.
Closing: Positioning Ahead of a Volatile Catalyst
Nvidia stock enters its earnings report in a genuinely balanced technical position, with no clear directional edge. The daily trend remains structurally bullish above the 200-day EMA, yet momentum has clearly cooled. The hourly chart shows tentative signs of stabilization that have not yet been confirmed.
At the same time, the 15-minute chart reflects the tight, nervous consolidation typical of pre-earnings positioning. Given the daily ATR of 5.6, the stock is likely to move sharply after the report. Volatility around this catalyst should not be underestimated.
Overall, signals are mixed across timeframes, and the outcome rests heavily on the earnings reaction. This remains a market defined by uncertainty rather than clear directional conviction.
FAQ
Is Nvidia stock’s long-term uptrend still intact?
Yes. NVDA closed at $213.05, above the 50-day EMA at $210.56 and the 200-day EMA at $196.81. The broader uptrend remains intact even as short-term momentum has cooled.
What level would confirm a bullish breakout for Nvidia stock?
A bullish continuation would require reclaiming the 20-day EMA at $214.62 and pushing through daily pivot resistance at $215.15. Confirmation would also need the hourly MACD histogram to keep expanding and RSI readings to move above 50.
What would signal a deeper pullback in NVDA?
A failure to hold the daily pivot at $212.63, followed by a break below daily support at $210.53, would signal the stall is deepening. Downside could extend toward the lower Bollinger band near $195.09.
What revenue guidance is Nvidia reportedly providing?
Jensen Huang is reportedly guiding toward $91 billion in revenue, with commentary suggesting the stock could break toward $325 if the report satisfies elevated expectations.
Disclaimer: This article is for informational purposes only and does not constitute financial advice, an investment recommendation, or a solicitation to buy or sell any financial instrument or cryptocurrency. The analysis provided is not indicative of future results. Investing in crypto assets and financial markets carries a high risk of capital loss. Always do your own research (DYOR) and consult a qualified financial advisor before making any decision.
Article produced with the assistance of artificial intelligence and reviewed by the editorial team.
