




Meta stock is caught between a bearish daily trend and a stabilizing hourly chart. Price sits below key moving averages, yet momentum signals consolidation rather than continuation lower — just as the market digests a $17 billion settlement and debates Meta’s AI strategy.
Summary
Key takeaways
- Meta stock closed at 572.34, below its 20-day EMA (574.83), 50-day EMA (587.90), and 200-day EMA (624.16).
- The daily MACD histogram turned positive at 2.16, signaling fading downside momentum despite the bearish regime.
- Hourly price action shows consolidation, with META wedged between the 50-hour EMA (569.89) and the 200-hour EMA (581.76).
- Meta’s $17 billion legal settlement removes a major uncertainty overhang that had weighed on sentiment.
- A break above the daily pivot resistance at 577.63 could open the path toward the 50-day EMA at 587.90.
Meta Stock Daily Chart: Bearish Regime with Easing Momentum
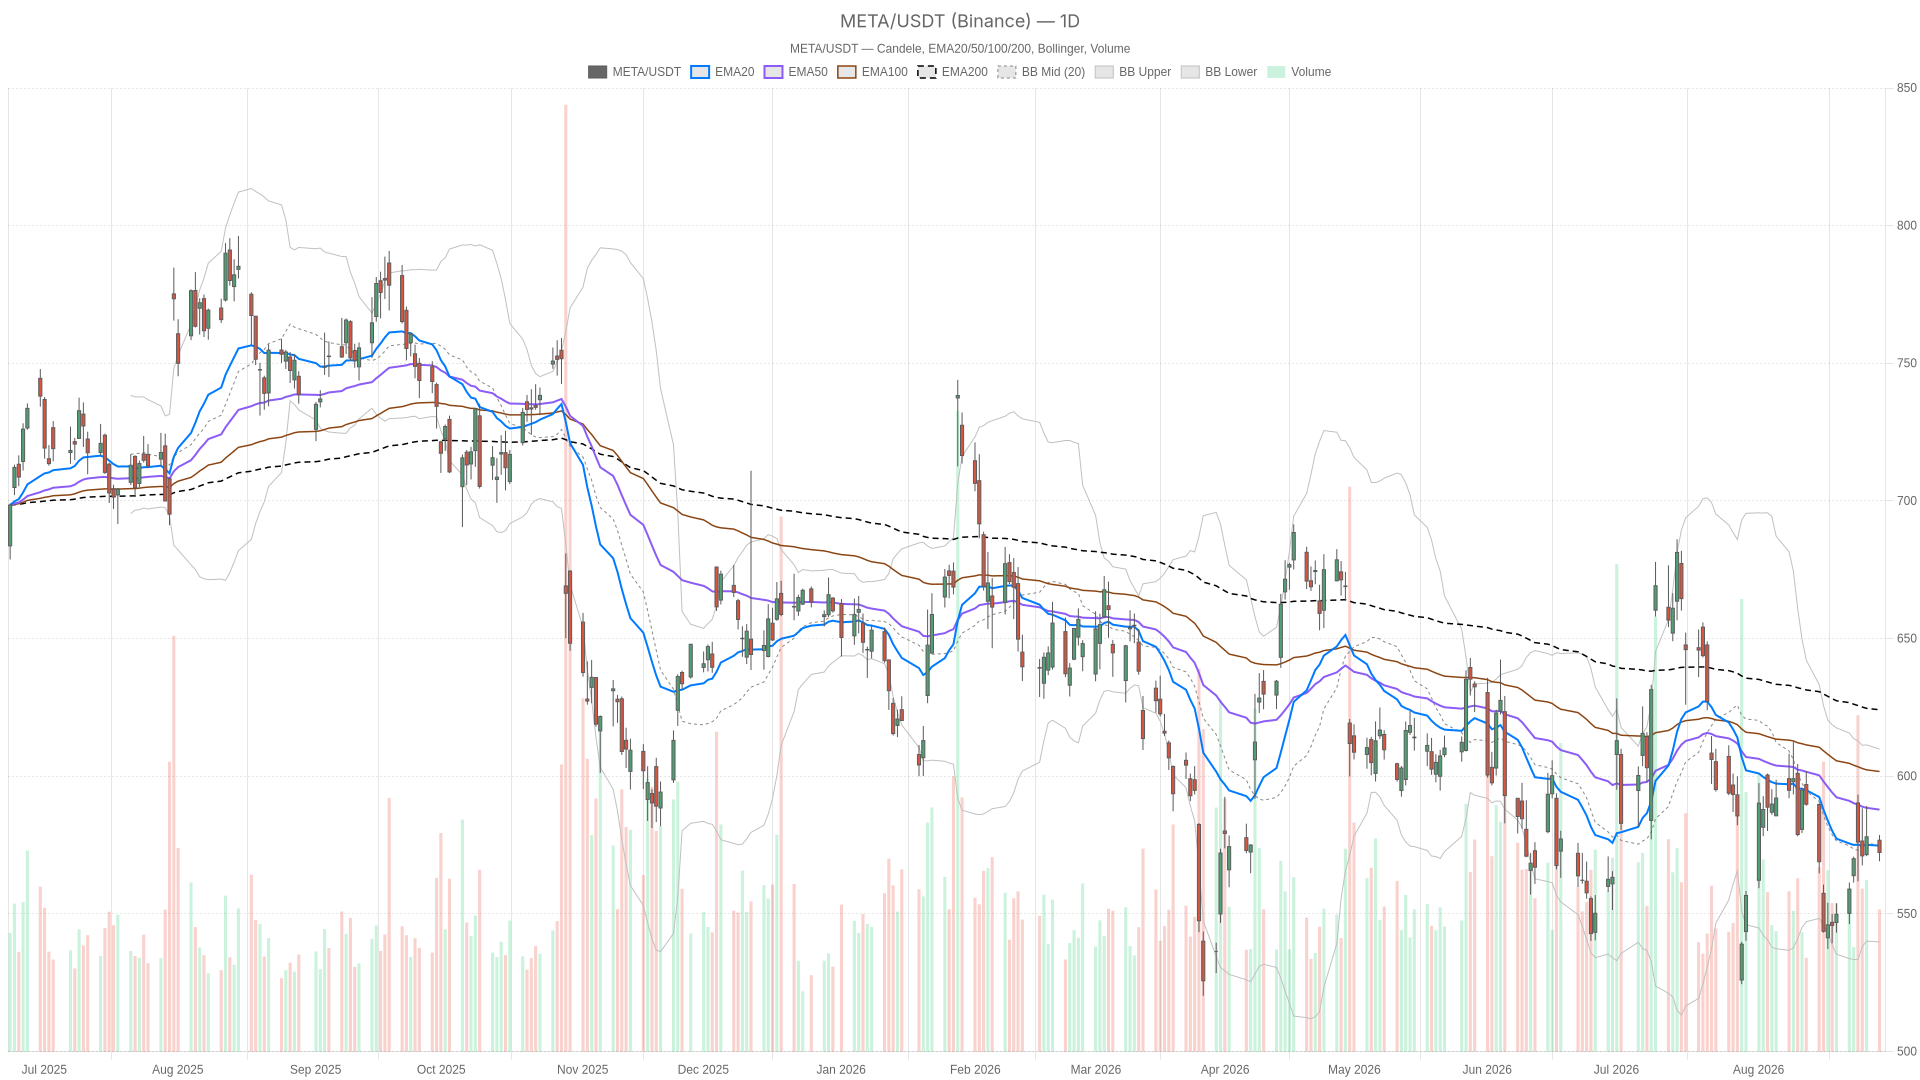
Meta stock remains in a bearish daily regime, trading below all three major moving averages — though momentum indicators suggest selling pressure is fading rather than accelerating.
Moving Average Stack Confirms Bearish Structure
On the daily chart, META closed at 572.34. The session high reached 578.67 and the low touched 569.14. Price sits just below its 20-day EMA at 574.83. The gap widens meaningfully against the 50-day EMA at 587.90 and the 200-day EMA at 624.16. This stacking — price under all three averages, with shorter ones below longer ones — is precisely why the system still flags the daily regime as bearish. The trend since the highs has been one of steady distribution, not a sharp crash.
Momentum Indicators Flash Subtle Improvement
The daily RSI14 reads 47.48 — essentially neutral and not oversold. This means sellers have not exhausted themselves, yet buyers have not been run over either. Meanwhile, the MACD line at -7.57 remains below its signal at -9.73, confirming the broader downtrend. However, the histogram has turned positive at 2.16. That is a subtle but important detail: downside momentum is fading even though the trend itself has not flipped yet.
The daily Bollinger Bands add further context. With the mid-band at 574.87, the upper band at 609.90 and the lower band at 539.85, price hovers right around the middle of the range. In contrast to a stock pinned against its lower band, META is not stretched or panicking — it is simply consolidating inside a wide structure. The daily ATR14 at 18.01 confirms volatility remains elevated relative to price. The daily pivot sits at 573.38, with resistance at 577.63 and support at 568.09, levels that roughly bracket the recent trading range.
Meta Stock Hourly Chart Points to Consolidation
Meta stock shows clear consolidation signals on the hourly timeframe, with price wedged between short-term support and longer-term resistance — a textbook signature of indecision rather than trend continuation.
Price Sandwich Signals Indecision
On the 1-hour chart, META’s close of 572.91 sits almost exactly on its 20-hour EMA at 572.74. At the same time, price trades above the 50-hour EMA at 569.89 and below the 200-hour EMA at 581.76. That sandwich structure — wedged between a supportive short-term average and a heavier long-term one overhead — is a classic signature of consolidation rather than trend continuation.
Short-Term Momentum Softens
The hourly RSI14 at 51.59 sits right at the midpoint, reinforcing that neither buyers nor sellers currently control the tape. The hourly MACD line at 0.91 remains below its signal line at 1.77, and the histogram at -0.86 confirms short-term momentum has softened. Notably, this creates a mild conflict with the daily picture: the daily histogram is improving while the hourly histogram is fading. That is a classic sign of a market pausing to digest recent moves.
Meanwhile, Bollinger Bands on the hourly chart show a mid-band at 573.44, an upper band at 580.71 and a lower band at 566.16 — again placing price near the center of its range. The hourly ATR14 at 5.87 is modest relative to the daily reading, suggesting intraday volatility has calmed. The hourly pivot at 573.17, with resistance at 574.90 and support at 571.18, mirrors the tight, indecisive range.
15-Minute Chart: Compression Before a Move
The 15-minute chart is useful only for timing entries, not for shaping the broader thesis. META closed at 572.91, with EMA20 at 572.40, EMA50 at 573.11 and EMA200 at 569.93. The short-term averages essentially overlap — a clear sign of compression. RSI14 at 51.46 and a MACD histogram of just 0.36 both point to muted momentum.
Meanwhile, Bollinger Bands are notably tight, with the upper band at 573.46 and the lower at 570.22. Price is pressing toward the upper edge of that narrow envelope. ATR14 at just 1.77 confirms this is a low-volatility execution window — exactly the kind of setup that tends to precede a directional move once the daily or hourly bias resolves.
Bullish Scenario for Meta Stock
The bullish case for Meta stock leans on the fundamental backdrop more than pure technicals at this stage. Meta reported strong Q2 2026 revenue growth, with ad revenue per person up 24% and total revenue up 27%. Some analysts argue the market has failed to properly price in these numbers.
Additionally, the recent $17 billion settlement of a federal lawsuit removes a meaningful overhang of legal uncertainty. If the daily MACD histogram continues improving and price reclaims the 20-day EMA near 574.83 with conviction — followed by a push through daily pivot resistance at 577.63 — that would open the door toward the 50-day EMA at 587.90. Some commentary has even floated the idea of META reclaiming its all-time high over the next few years, contingent on the ad business sustaining its current trajectory.
Bearish Scenario and Invalidation Levels
The bearish case remains the default position as long as the daily regime stays tagged bearish. A failure to hold daily support at 568.09 would likely accelerate selling pressure toward the lower Bollinger Band near 539.85.
Furthermore, if the hourly chart loses its footing below the 50-hour EMA at 569.89, that would remove the last piece of near-term technical support and confirm sellers are back in control across timeframes. Price below both the 200-day EMA at 624.16 and the 200-hour EMA at 581.76 remains the clearest evidence that the broader trend still works against bulls — regardless of how constructive the fundamental narrative sounds.
Meta Stock Outlook: Balancing Binary Risks
Overall, Meta stock is caught between a daily trend that remains bearish on paper and an hourly structure that looks increasingly neutral. Therefore, the immediate path likely hinges on how price behaves around the daily pivot at 573.38 and the tight 15-minute range just below it. Volatility, as measured by ATR across all three timeframes, has been compressing. This typically precedes a more decisive move rather than prolonging the current indecision. Positioning here should account for that binary risk, since neither the bullish fundamental narrative nor the bearish daily trend has fully won the argument yet.
FAQ
Is Meta stock in a bearish or bullish trend right now?
The daily chart still carries a bearish tag. Meta stock trades below its 20-day EMA (574.83), 50-day EMA (587.90), and 200-day EMA (624.16). However, the hourly chart shows signs of stabilization and consolidation rather than continuation lower.
What does Meta’s $17 billion settlement mean for the stock?
The $17 billion settlement removes a major legal uncertainty that had been weighing on investor sentiment. While it does not change the technical picture overnight, it clears a significant overhang and strengthens the fundamental bull case.
What are the key levels to watch for Meta stock?
Key resistance sits at the daily pivot of 573.38 and 577.63. A break above those opens the path to the 50-day EMA at 587.90. On the downside, support at 568.09 is critical. A breakdown below that could accelerate selling toward the lower Bollinger Band near 539.85.
Is Meta stock a buy at current levels?
The technical picture is mixed. The daily trend is bearish, but momentum is improving, and the hourly chart shows consolidation. Traders are watching for a decisive break above resistance or below support before committing directionally — especially given compressed volatility across timeframes.
Disclaimer: This article is for informational purposes only and does not constitute financial advice, an investment recommendation, or a solicitation to buy or sell any financial instrument or cryptocurrency. The analysis provided is not indicative of future results. Investing in crypto assets and financial markets carries a high risk of capital loss. Always do your own research (DYOR) and consult a qualified financial advisor before making any decision.
Article produced with the assistance of artificial intelligence and reviewed by the editorial team.
