




Credo Technology Group Holding stock faces a critical technical test after shares tumbled from $220 to $206.63 on September 1. The sell-off coincided with record fiscal first-quarter 2027 revenue of $479 million, up 115% year-over-year, creating a sharp disconnect between AI-driven fundamentals and price action.
Summary
Key takeaways
- Credo reported record Q1 FY2027 revenue of $479 million, up 115% year-over-year, with CEO Bill Brennan citing surging AI infrastructure connectivity demand.
- CRDO shares dropped from an intraday high of $221.74 to close at $206.63 on volume of 8.6 million shares despite the strong earnings beat.
- Daily RSI14 at 40.9 and a MACD histogram of -3.41 confirm bearish momentum, while the 200-day EMA at $187.33 keeps the long-term uptrend intact.
- Both the hourly and 15-minute timeframes are flagged as bearish, though oversold RSI readings hint that selling pressure may be nearing exhaustion.
- Analyst coverage remains constructive, with Seeking Alpha rating the stock a Buy and GF Value pointing to 64% upside potential.
That disconnect between headline growth and price action is the core tension now. The daily chart carries a neutral regime tag, yet several indicators already lean bearish. Meanwhile, the hourly and 15-minute timeframes are unambiguously bearish. This multi-timeframe disagreement defines how traders should read the setup.
Daily Chart: Credo Technology Group Holding Stock Breaks Below Key Averages
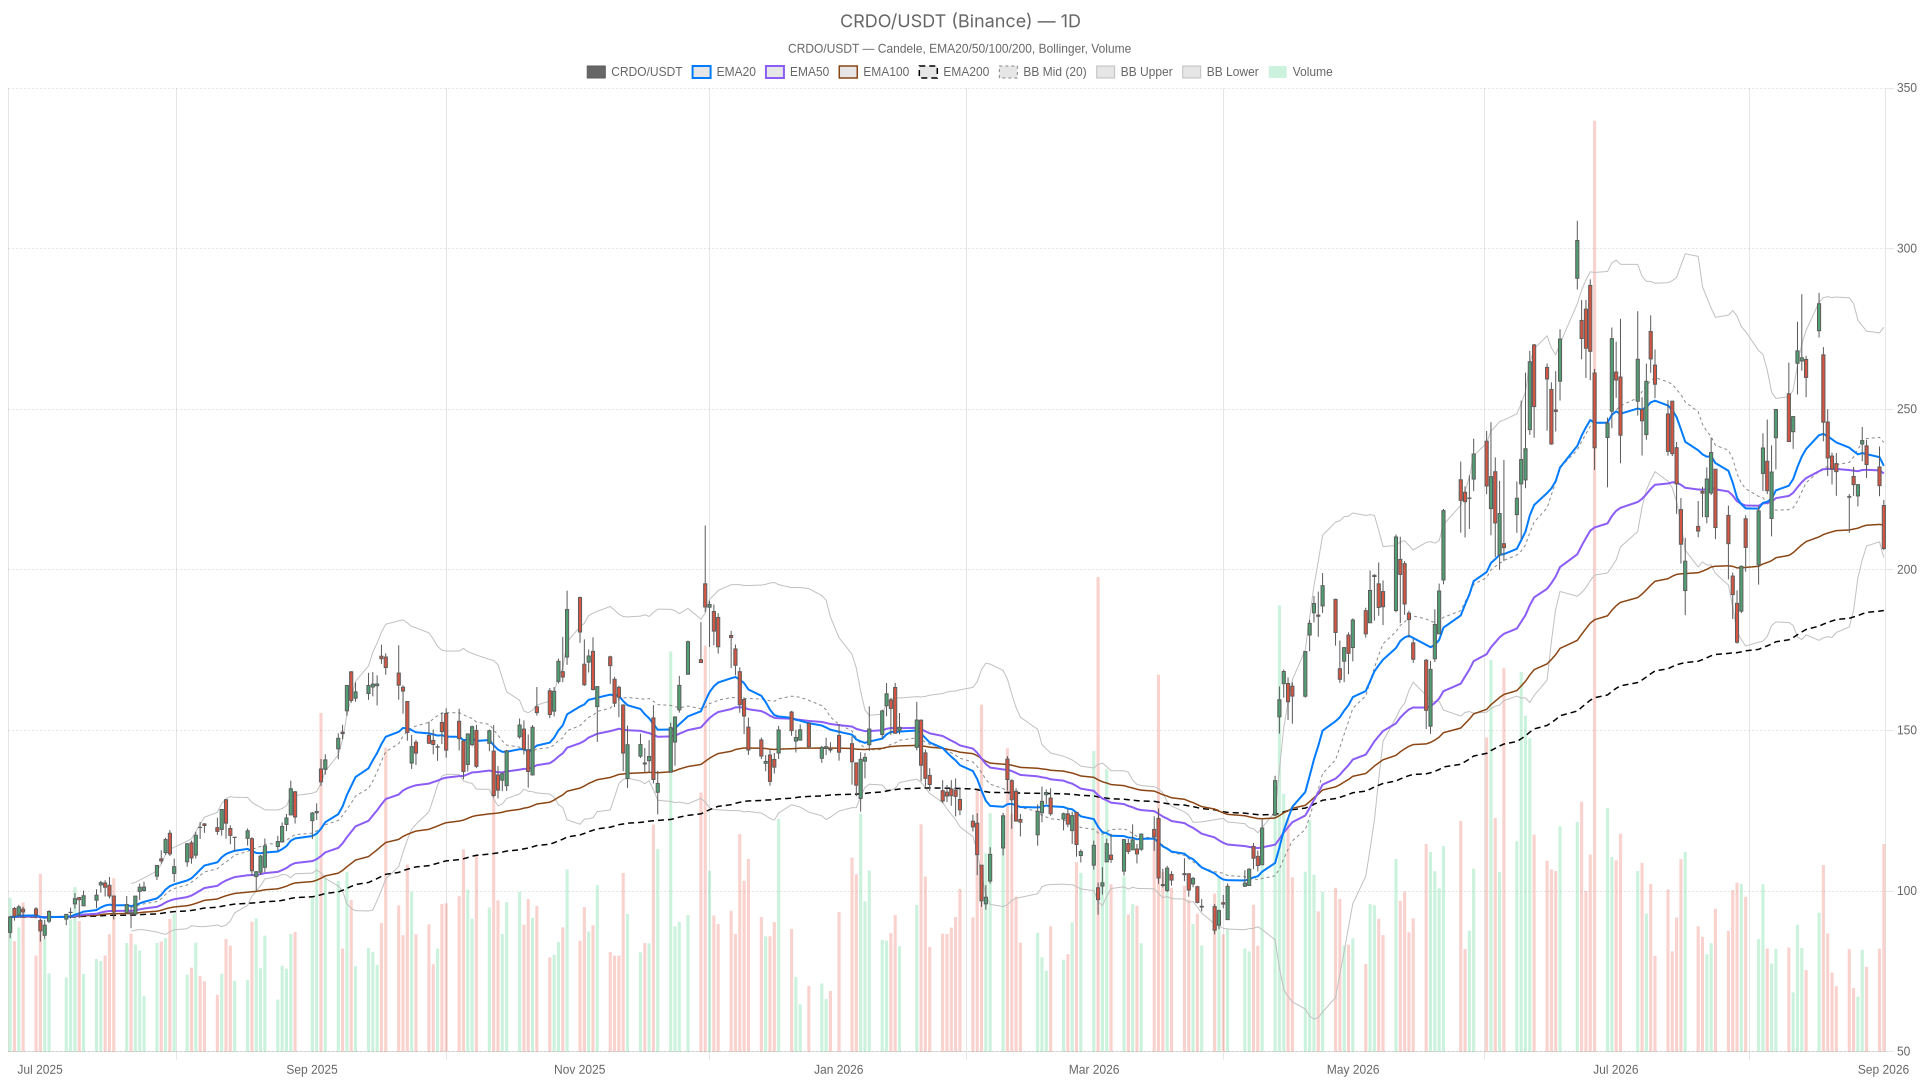
The daily chart shows Credo Technology Group Holding stock breaking decisively below both short-term moving averages, signaling a loss of near-term trend support even as the broader uptrend structure holds.
EMA Stack Under Pressure
Price closed at $206.63, well below the 20-day EMA at $232.36 and the 50-day EMA at $229.99. However, the 200-day EMA sits far lower at $187.33, meaning the broader uptrend structure remains technically intact even after this drawdown. This gap between short-term and long-term averages is significant. It shows a stock that ran hard higher over the past year but is now giving back gains in a fast, volatile move.
Momentum and Volatility Signals
RSI14 on the daily sits at 40.9, not yet oversold but clearly weakening. MACD tells a sharper story: the line at -2.81 sits well below the signal at 0.6, producing a histogram of -3.41. That is a decisive bearish crossover, not a minor wobble.
Meanwhile, Bollinger Bands reinforce the same message. Price at $206.63 sits just above the lower band at $203.82, well below the mid-band at $239.68. The daily ATR14 of 17.91 confirms that volatility has expanded meaningfully, consistent with a stock digesting a violent single-session move. Pivot levels place the daily pivot at 211.5, with support at 201.25 and resistance at 216.88. Both levels will likely command attention in the sessions ahead.
1H Timeframe: Bearish Regime Confirms the Daily Weakness
The hourly timeframe confirms an outright bearish regime, with Credo Technology Group Holding stock trading beneath all three EMAs and RSI14 dipping into oversold territory at 29.03.
The hourly chart removes any ambiguity. Its regime is flagged outright as bearish, and the indicators back that up. Price at 206.95 sits beneath all three EMAs: the 20-hour at 220.96, the 50-hour at 226.96, and the 200-hour at 233.41. That is a fully bearish EMA stack. RSI14 at 29.03 is now in oversold territory. Meanwhile, MACD shows a line of -5.33 against a signal of -3.39, with a histogram of -1.95.
Notably, that hourly histogram of -1.95 is less negative than the daily’s -3.41. This suggests the pace of selling may be decelerating even as the broader trend stays down. Bollinger Bands on the hourly show price at 206.95 sitting almost directly on the lower band at 206.66. This zone often produces short-term stabilization attempts. Therefore, the 1H timeframe confirms the daily’s bearish tilt rather than contradicting it. Still, the oversold RSI hints that a near-term bounce is not out of the question.
15-Minute Execution Context
The 15-minute chart shows downside momentum flattening intraday, with the MACD histogram narrowing to near zero even as the broader bearish structure holds.
On the 15-minute chart, price at 206.95 remains below all EMAs. RSI14 at 27.95 confirms oversold conditions. However, the MACD histogram here has narrowed to just -0.04, essentially flat. The MACD line at -2.94 nearly touches the signal at -2.9. That flattening suggests downside momentum is losing steam at the intraday level.
Price is also sitting right on the lower Bollinger band at 207.08, near the 15-minute pivot support of 205.57. For short-term execution, this zone is where any stabilization attempt would likely first show up.
Bullish Scenario: Can Fundamentals Override the Technical Damage?
The bullish case for Credo Technology Group Holding stock hinges on fundamentals overriding technical damage, with record revenue and a 64% upside target providing the narrative backbone.
The bullish case rests heavily on fundamentals overriding technical damage. Seeking Alpha rates the stock a Buy, citing robust AI infrastructure demand and attractive growth-to-valuation dynamics. Meanwhile, Yahoo Finance notes GF Value sees 64% upside. The company posted record $479 million in revenue. A $600 million optical revenue ramp is also in focus for coming quarters. There is a credible case that this pullback represents a valuation reset rather than a trend reversal.
A recovery back above the daily pivot at 211.5 would be the first technical confirmation bulls need. A subsequent reclaim of the 20-day EMA near 232.36 would strengthen the case further. Given the stock’s position well above the 200-day EMA at 187.33, the long-term uptrend still has room to reassert itself. This requires buyers to step back in.
Bearish Scenario: Downside Risks Remain in Play
The bearish scenario draws strength from the decisive MACD crossover, with multiple risk factors including valuation concerns and supply constraints reinforcing the downside case.
The bearish scenario for Credo Technology Group Holding stock is reinforced by real risk factors. These include valuation concerns, supply constraints, and customer concentration. A break below the daily support at 201.25 would invalidate the bullish reset narrative. A failure to hold hourly support near 204.02 would have a similar effect. Either scenario would open the door to a deeper correction toward the lower Bollinger band structure.
Given the daily ATR14 of 17.91, moves of that magnitude are well within the stock’s current volatility profile. If MACD histograms across the daily and hourly timeframes continue widening negatively rather than converging, that would confirm sellers remain in control.
Closing Thoughts: A Mixed Setup Demands Patience
Credo Technology Group Holding stock presents a mixed technical picture, with long-term uptrend structure intact but short-term momentum clearly deteriorated.
Overall, Credo Technology Group Holding stock sits in a genuinely mixed technical position. The daily trend remains constructive in the bigger picture thanks to its distance above the 200-day EMA. However, the hourly and 15-minute regimes are bearish and momentum has clearly deteriorated in the short run.
At the same time, oversold readings on both the 1H and 15m RSI suggest the immediate selling pressure could be nearing exhaustion. Volatility is elevated and positioning is likely mixed among traders reacting to the earnings beat versus the sharp price reversal.
Ultimately, near-term direction will probably hinge on whether price can defend the pivot and support zones outlined above. Until that resolves, uncertainty remains the dominant feature of this setup.
FAQ
Why did Credo Technology Group Holding stock fall despite record revenue?
Credo Technology Group Holding stock dropped from $220 to $206.63 on September 1 despite reporting record fiscal Q1 2027 revenue of $479 million, up 115% year-over-year. The sell-off likely reflects profit-taking after a strong run higher, combined with persistent concerns around valuation, supply constraints, and customer concentration already flagged in analyst coverage.
Is Credo Technology Group Holding stock still in a long-term uptrend?
Yes, the long-term uptrend remains technically intact. Price at $206.63 sits well above the 200-day EMA at $187.33, meaning the broader bullish structure has not been invalidated. However, the break below both the 20-day and 50-day EMA signals that near-term trend momentum has shifted bearish.
What are the key support and resistance levels for CRDO?
Key support levels include the daily support at 201.25 and hourly support near 204.02. On the resistance side, the daily pivot at 211.5 is the first hurdle, followed by resistance at 216.88. A more significant recovery would require reclaiming the 20-day EMA near 232.36.
What is the analyst outlook for Credo Technology Group Holding stock?
Seeking Alpha rates Credo Technology Group Holding stock a Buy, citing robust AI infrastructure demand and attractive growth-to-valuation dynamics. Yahoo Finance notes GF Value sees 64% upside. The company also highlighted a $600 million optical revenue ramp for coming quarters, reinforcing the fundamental growth narrative.
Disclaimer: This article is for informational purposes only and does not constitute financial advice, an investment recommendation, or a solicitation to buy or sell any financial instrument or cryptocurrency. The analysis provided is not indicative of future results. Investing in crypto assets and financial markets carries a high risk of capital loss. Always do your own research (DYOR) and consult a qualified financial advisor before making any decision.
Article produced with the assistance of artificial intelligence and reviewed by the editorial team.
