Summary
Bitcoin Analysis
Following an all-time high weekly candle close on Sunday, BTC sold off to a session low on Monday of $60,390 before rallying to close Monday in green figures and +$523.
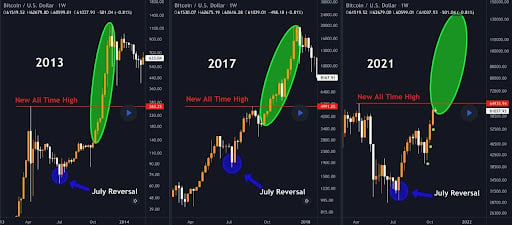
The 1W BTC chart below from Toni_G21 shows how a measured move similar to the ones following the 2013 and 2017 bitcoin halvings and those cycles could potentially play out to close the 2021 version.
The chartist posits that the price could reach $130k which is double the current all-time high and could be a major profit taking level for traders that are mindful of that data.

As traders can see all 3 charts show a July reversal before continuing upward, this cycle obviously is the only one in doubt now and soon traders will find out whether bitcoin’s programmatic supply and scheduled emissions will continue to allow users to predict the future.
The Fear and Greed Index is 75 Greed and -3 from Monday’s reading of 78 Extreme Greed.
BTC’s 24 hour price range is $60,390-$62,794 and its 7 day price range is $54,767-$62,794. Bitcoin’s 52 week price range is $11,723-$64,804.
Bitcoin’s price on this date last year was $11,908.
BTC’s 30 day average price is $50,699.
Monday’s BTC daily candle closed at $62,034 and +0.85%.
Ethereum Analysis
Ether’s price action on Monday finished in red figures and continues to bounce between $3,2k and $4k.
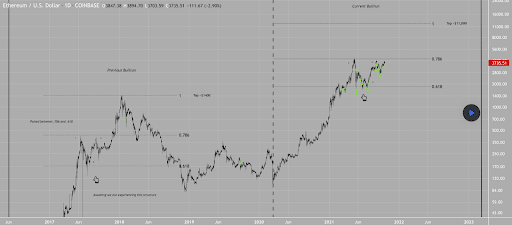
The 1D Ether chart below from Bixley shows that a 2017 / 2018 fractal that occurred and took Ether to a new all-time high could be setting up again.
Ether bulls are continuing their attempt to claim the 0.786 as their own before attempting to take out strong overhead resistance at $4k.

If bears want to regain control of Ether’s price action they really need to push the price below $3,5k. The longer ETH’s price consolidates in this tight region the higher the probability of seller exhaustion becomes for bulls looking for an edge on the market.
ETH’s 24 hour price range is $3,699-$3,897 and its 7 day price range is $3,426-$3,959. Ether’s 52 week price range is $368.56-$4,352.11.
Ether’s price on this date last year was $368.23.
The average ETH price for the last 30 days is $3,354.
Ether’s Monday daily candle close was $3,747 and -2.52%.
Luna Analysis
Luna’s price has been consolidating in a tight range since October 10th.
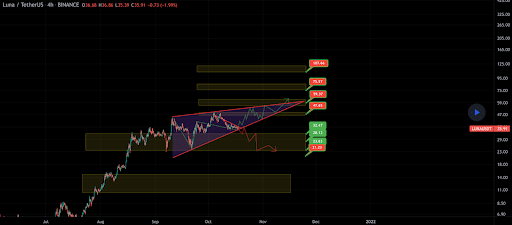
The 4hr Terra chart below from Abietrading shows a rising wedge pattern with targets to the upside of $47.65, $59.37, $75.57, and $107.66.
Bearish targets to the downside if Luna bears can breach the current pattern are $32.47, $28.12, $23.83. Luna bulls will have a last stand before another major markdown in price at $21.23 but that level should act as a strong support resistance for bulls.

Luna’s 24 hour price range is $35.38-$37.37 and its 7 day price range is $35.32-$39.44. Terra’s 52 week price range is $23.97-$49.48.
Luna’s price on this date last year was $.30.
The average price for Terra over the last 30 days is $37.72.
Luna [-0.92%] closed Monday’s daily candle worth $35.80 and in red digits for a fourth consecutive day.


