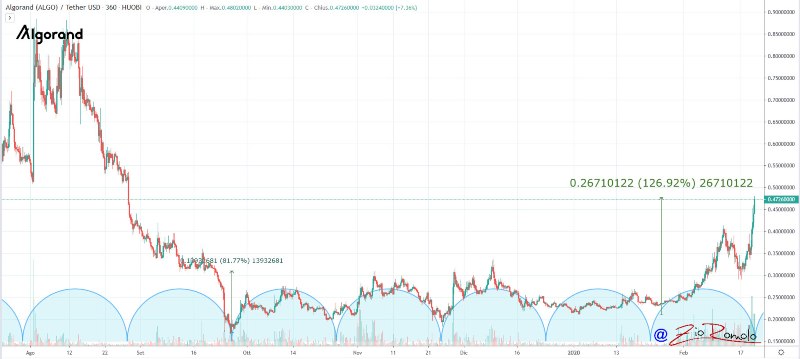
After the strong declines that have characterized the last few days with daily double-digit drops which had not been seen since September of last year, today the green sign prevails again, albeit faintly. The price of Algorand (ALGO) stands out, which is the best of the day with a climb that goes over 20% and causes its prices to fly above the 48 cents which it had abandoned at the end of August 2019. Algorand has doubled its price since the beginning of the year.
Among the top 20, there is a perfect balance of positive and negative signs. Bitcoin and Ethereum are up again with +1%, Ripple (XRP) falls with the same intensity, while Bitcoin Cash (BCH) and Bitcoin SV (BSV) are down between 1 and 3%.
Compared to the last days, when Tezos (XTZ) and Chainlink (LINK) seemed to be sailing out of the storm that hit the entire sector, with positive signals, today both are down 1.5%.
On a weekly basis, however, both Tezos and Chainlink are among the few that show positive double-digit performance, both up 11%. Outperforming them in the top 100 there is only Algorand which is up by 35%.
Among the worst of the day today there are Decentraland (MANA), in 92nd position, which loses 11% and Hedera Hashgraph (HBAR), in 49th position with 145 million dollars of capitalization, which after the excellent performance of recent days today loses 3%.
The sector continues to remain strong with total trading volumes exceeding $164 billion on a daily basis and Bitcoin continues to trade with a daily average of over $1 billion. This highlights how the period is vibrant and there is particular attention from traders.
Recent declines have increased daily volatility, however, in a monthly context, it has increased only from 2.5% in mid-February (the lowest level since last September) to 2.8%. Volatility remains low when considering the peaks reached in November when it reached 4% on a monthly basis.
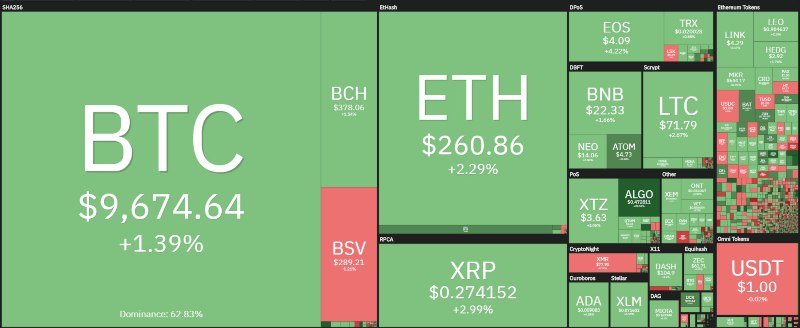
Bitcoin dominance remains at its lowest levels in recent months just under 63%, levels recorded in July 2019. Ethereum returns to push just above the 10% threshold, while Ripple instead slows the price rise but keeps the dominance around 4.3%.
Bitcoin (BTC)
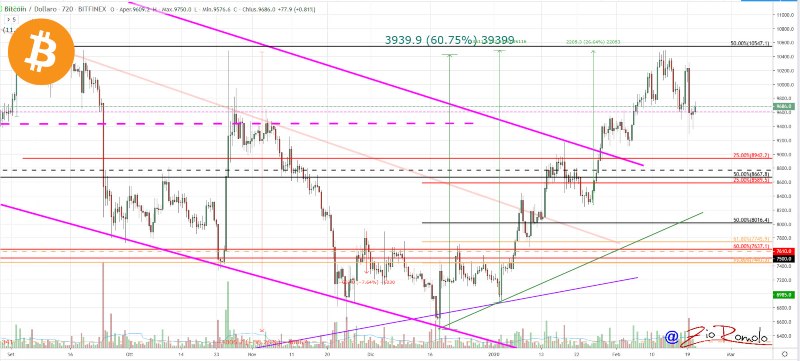
As happened two times out of three when the golden cross developed, the profit-taking prevailed. Since Tuesday, when the golden cross took place, Bitcoin has surrendered the $10,000 psychological level and today is trying to confirm the mid-term support of $9,500-9,600 thanks to purchases. The hold will need to be confirmed over the weekend.
At the moment, the bullish trend remains impacted but it is necessary to return above the $10,000 threshold as soon as possible. If the $9,500-9,600 support breaks, the $8,800 holding is decisive.
Ethereum (ETH)
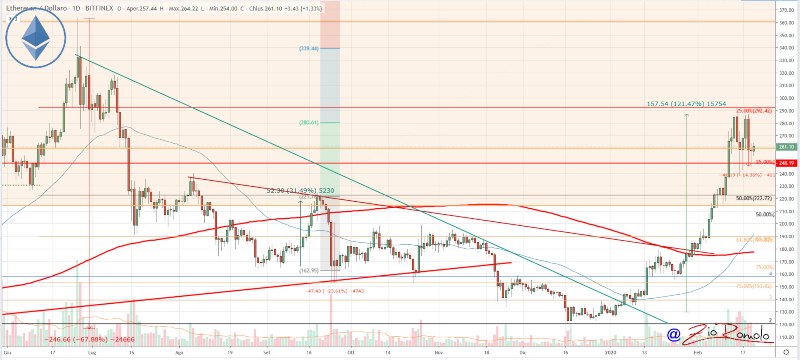
Ethereum reacts to the sinking of the last 48 hours during which it lost about 15% from Wednesday’s high by returning to the $160 threshold. If ETH stays above $158 on Sunday night it would mark the 9th consecutive week upward, an event that hasn’t occurred since 2016. It would be an auspicious sign of strength for the Bulls in the coming weeks.
Ethereum is far from the double maximum in the area of $287 on February 15th and 17th. This is the level that in case of breakage, coupled with volumes, would most likely project prices beyond the psychological threshold of 300 dollars. Despite the setback that has occurred in the last two days, Ethereum’s prices have doubled since the beginning of the year with a gain of just over 100%. Among the top 20 altcoins, it is one of the 5 biggest rises since the beginning of the year.
For ETH, it is now necessary to keep the prices above 235 dollars. Only a return below this level would indicate a first bearish signal.


