The last week of February, with more than 90% of the cryptocurrency in negative territory, is about to end with a sharp decline, meanwhile there is a real crash in the stock market.
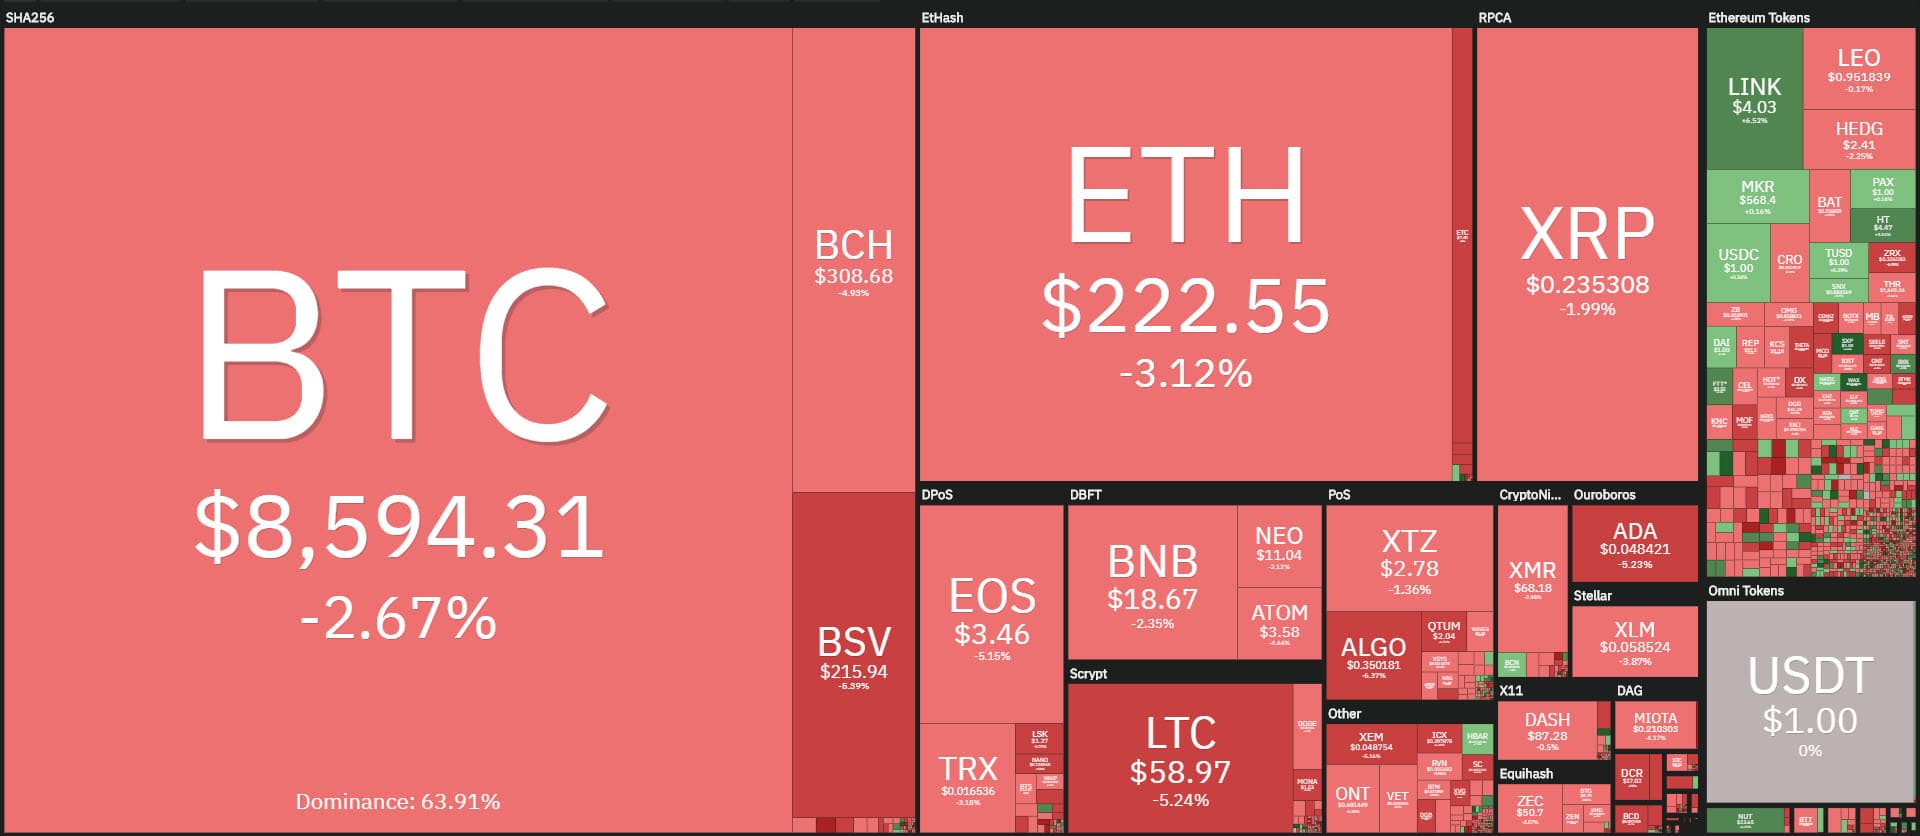
The cryptocurrency sector sees a clear prevalence of signs in red. It has not happened since mid-November. Among the top 100, only two closed in positive on a weekly basis.
These are WaykiChain (WICC) and Aion (AION), both up by 11%. They are the only two positive signs amidst the rest of the sector showing red signs and declines of more than 10%.
Among the top 30, only the Leo (LEO) token is holding back the decline with -3% on a weekly basis. Bitcoin (BTC) loses 12%, the worst is Ethereum (ETH) with a drop close to 20%, Ripple (XRP) is halfway with -16%.
These are declines in line with traditional stock markets. The negative trend also characterizes gold, which closes the week in red after hitting the highs of the past 7 years at $1,700 an ounce.
A devastating week for the stock markets that close with double-digit declines, an unusual characteristic that links them to the cryptocurrency markets, which, however, are a very volatile sector compared to the stock market.
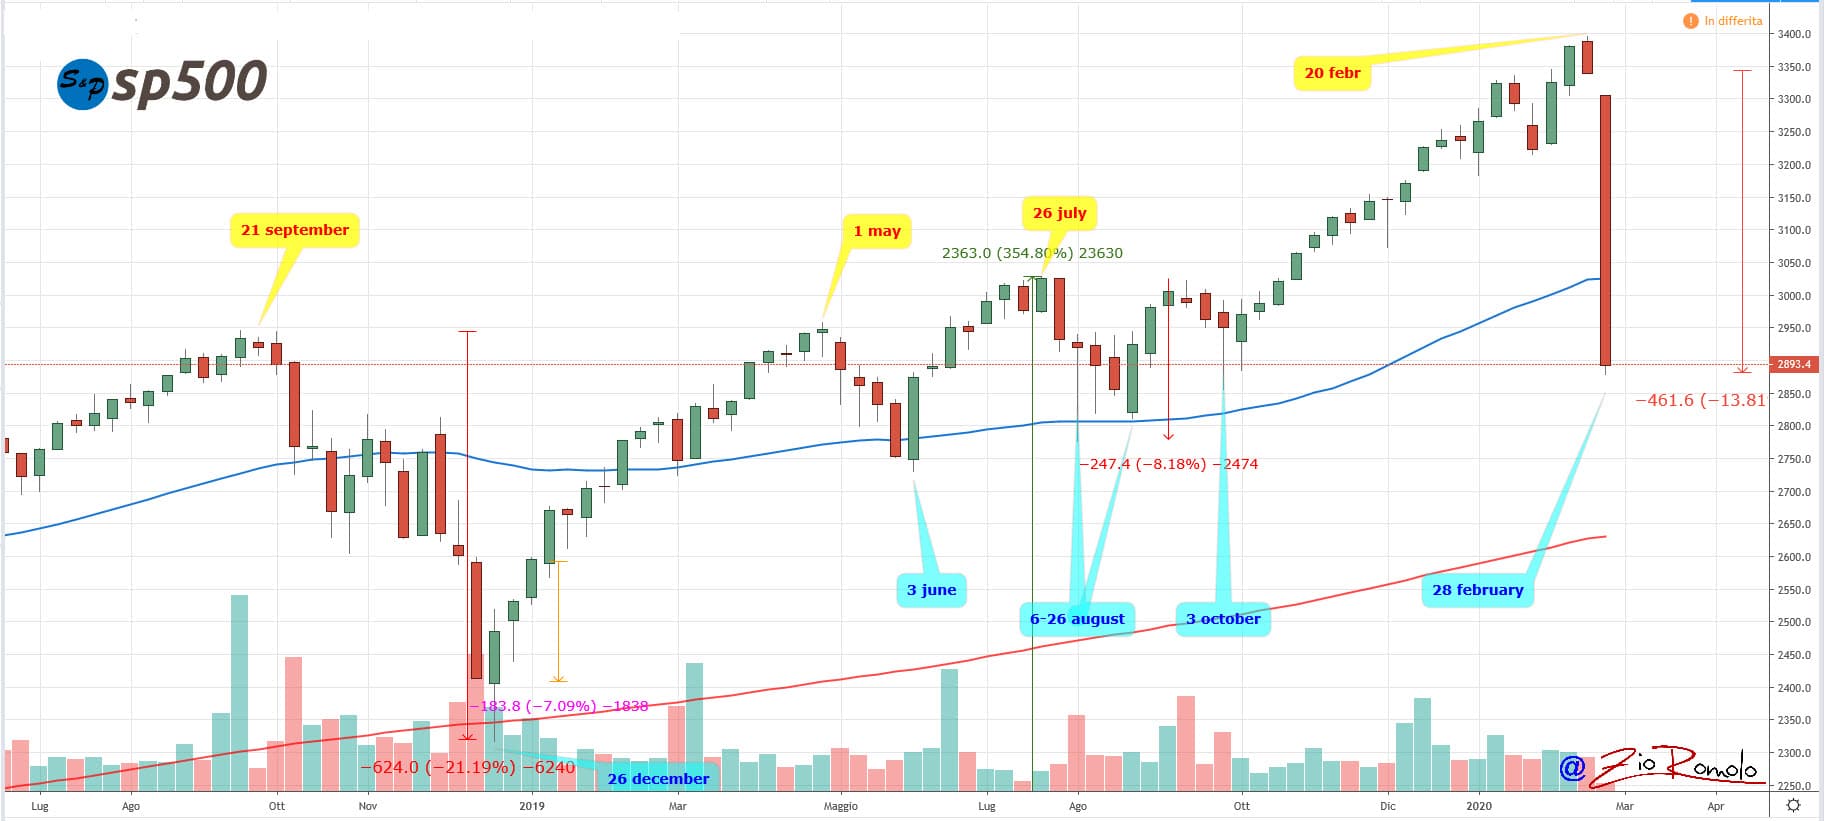
Looking at the S&P 500, America’s leading global index, it is falling on a weekly basis by more than 13%, an event not seen since October 2008, when global financial markets were hit by the latest subprime mortgage crisis, the last major recession that unites the fears spreading globally across all markets during this period.
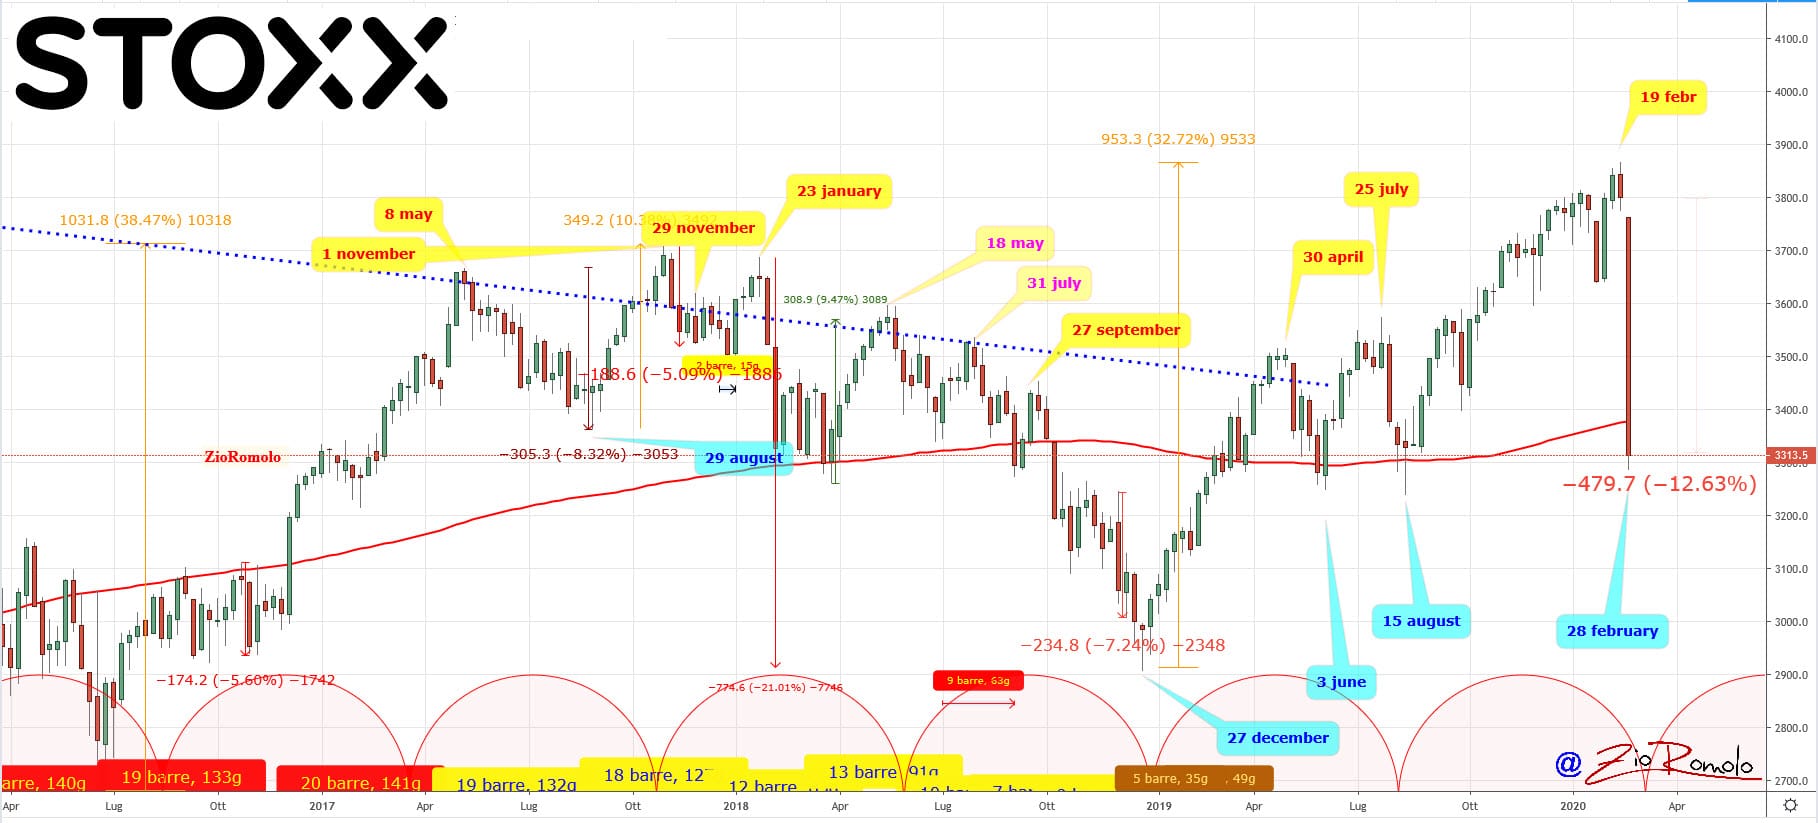
The European Eurostoxx index also fell sharply, losing more than 12% on a weekly basis in line with the S&P 500. This is a decline that Eurostoxx last recorded in 2015 with the same intensity.
The VIX, after breaking the panic selling threshold at 30 points, now stands at 47 points, the highest level recorded since February 2018. An index that to date, unlike two days ago, indicates that world markets are in full panic. Panic selling and fears will continue to be felt in the coming weeks and probably in the coming months.
The cryptocurrency sector is on the threshold of a possible global recession for the first time. These weeks will be turbulent where volatility will continue and will not recover from these levels within a few days. This situation in the markets has not been seen in over 10 years.
But unlike in 2008, the crypto sector could play a decisive role in the paradigm shift with alternative assets. It will be particularly interesting to understand Bitcoin’s role as a new safe-haven asset, as it seems to be acting like one since the beginning of the year.
Bitcoin’s daily volatility on a monthly basis increases slightly to 2.8%, remaining within the average of the last 10 months. Nothing at the moment that shows tensions, so much so that the declines that are being recorded in the last week for the cryptocurrency, unlike the world stock markets, are part of a movement that can be contextualized as part of a retracement after the strong rises that have characterized the past few weeks.
It should not be forgotten that the decline of Ethereum comes after 9 consecutive bullish weeks, an event that has not occurred since 2016.
Hence it is necessary to separate what happens in the crypto sector from what happens in traditional finance.
Volumes are down sharply by more than 30%. Trading remains above $100 billion on a daily basis, far from the levels recorded in mid-February when it exceeded $210 billion, double today’s levels.
The market cap is back firmly below $245 billion, a level that it recorded for the first time in a month, the last time being on January 28th.
Bitcoin’s dominance maintains yesterday’s values just above 64%, while Ethereum is back below the 10% threshold, the lowest level in the last two weeks. Ripple is recovering slightly beyond 4%.
In terms of monthly performance scrolling through the list of the top 20, among the top 10 there is only one positive sign, that of Ethereum that gains 25% since the beginning of February, and in 10th position Tezos (XTZ) has gained over 70% consolidating the 10th position, followed by Chainlink, in 11th position with +45% since February 1st.
Among the worst on a monthly basis are Ethereum Classic (ETC) losing 33% and Iota (IOTA) and Cosmos (ATOM) losing over 20%.
Summary
Bitcoin (BTC)
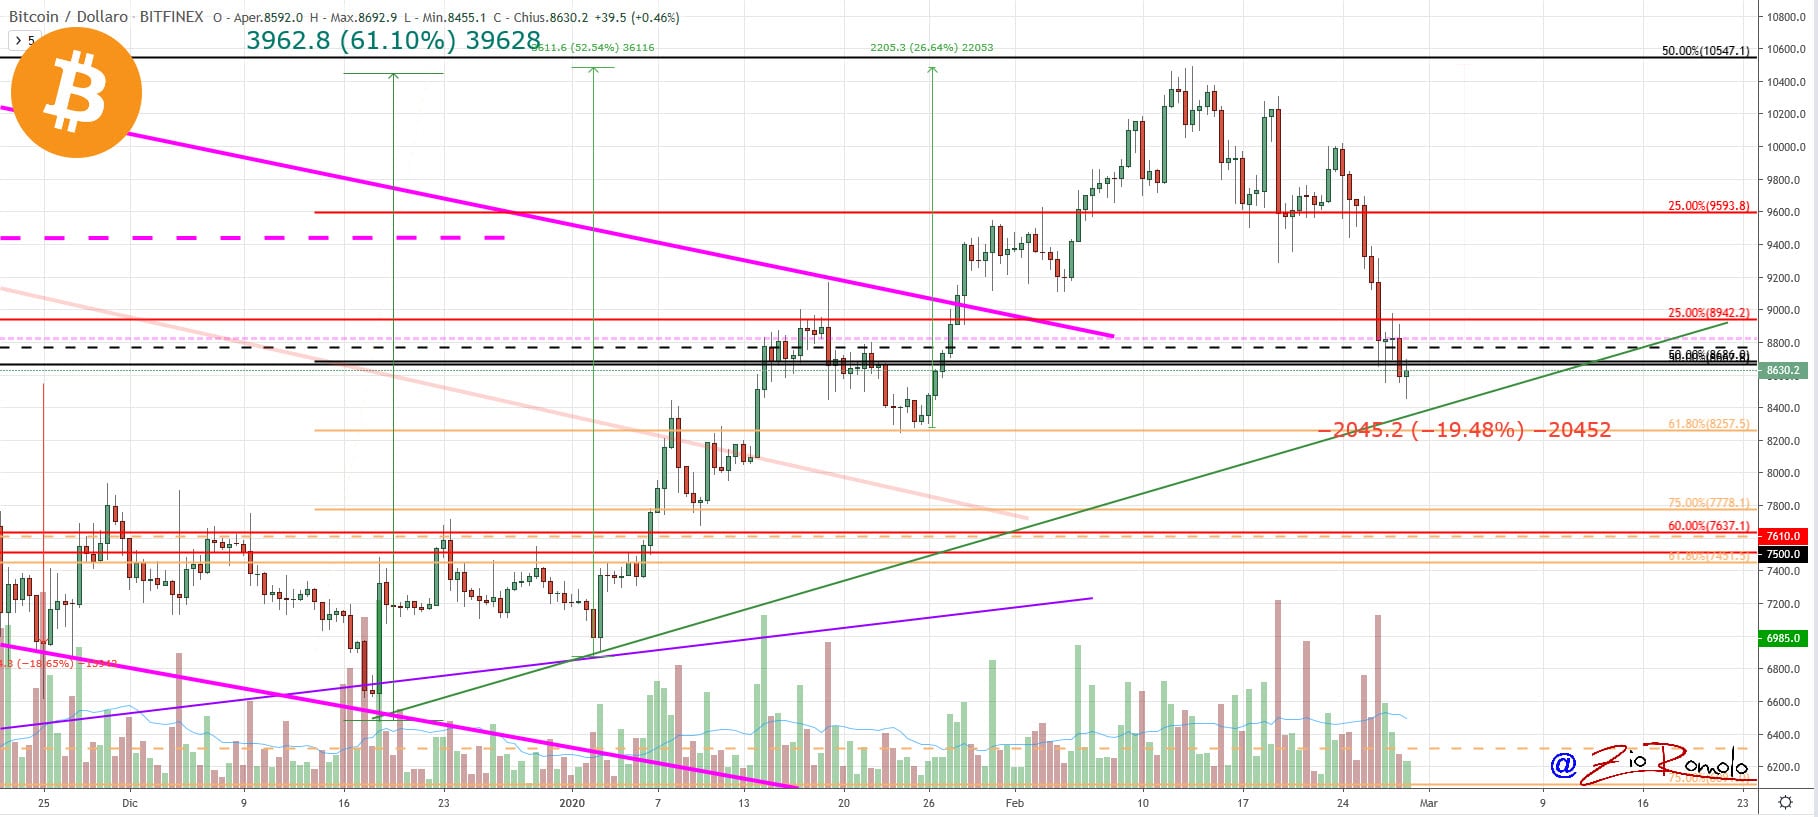
After breaking the $9,500 threshold three days ago and abandoning the $8,800 mark yesterday, Bitcoin goes on to test the critical support in the $8,500 area, a level where the trendline that supports the upward trend since mid-December passes, combining the upper low of early January.
It is a level to be monitored very carefully. In case of violation it will trigger a first wake-up call of the bullish trend for BTC, to then go to monitor the next level of support in the area 7,800-7,900 dollars, a level that, should this decline continue, would cancel the positive sentiment that had characterized these first weeks of 2020.
Nothing critical yet, but since prices are now close to alarming levels, it is better to monitor the holding of the ideal levels of support rather than new levels of increase left during the decline of this period of February.
Ethereum (ETH)
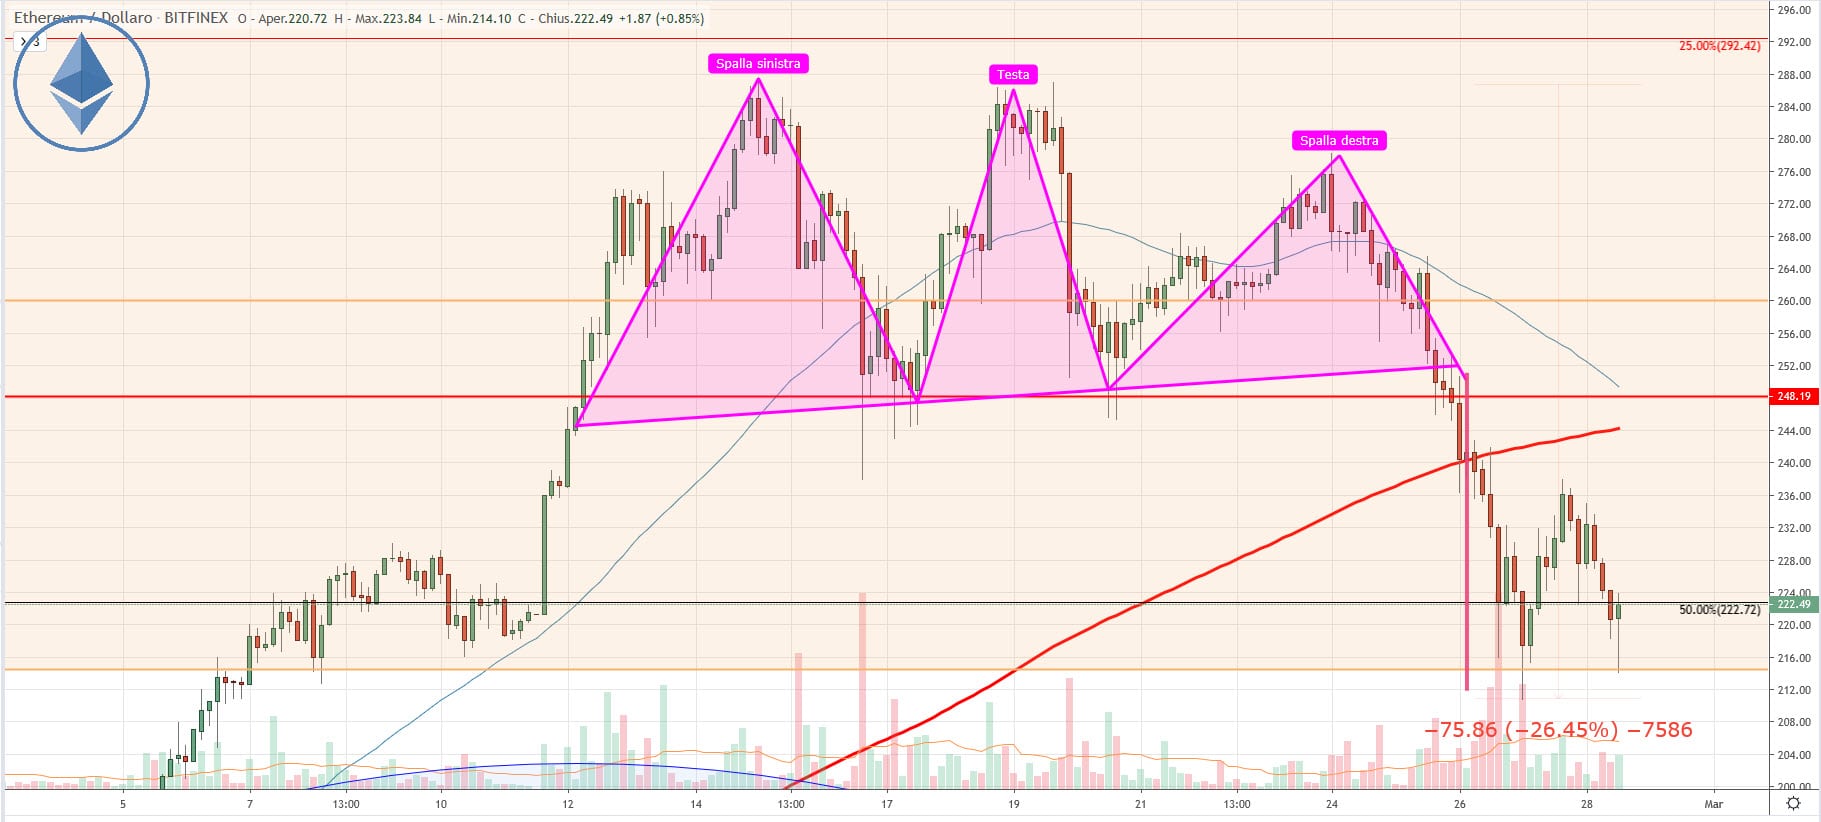
Following yesterday’s pullback that occurred after reaching the bearish head and shoulder target with a rebound in the $235 area, Ethereum prices are again falling back towards the $215-210 area.
For Ethereum the key level to maintain over the weekend is $215. In case of confirmation of a rupture, the next level of support is identified in the $190 area.
For Ethereum it is necessary not to inflict a hard blow to the bullish trend in place since the lows of mid-December. Below $190 would trigger for Ethereum a signal that would cancel much of the upward work done since mid-January and that has continued until the highs of mid-February.
There is nothing to indicate upwards for Ethereum because the level of resistance passes in the area $250, former level of support violated two days ago.

