The third day of the downtrend for the cryptocurrency sector, reflecting the trend that is developing in traditional markets.
The sell-off characterized the stock markets for the second consecutive day. European markets cancelled out the last 4 months and returned to the levels of October. The US indices are holding up better, with the S&P 500 falling back to mid-December levels.
It is a turbulent period where tensions are also reflected in the volatility remaining at high levels. The VIX index rose to 30 yesterday, reaching a new high, the highest since 2018, a technical condition that highlights the period of high tension in the stock markets. Beyond 30, in fact, stock markets may be considered in panic selling mode.
Whereas the Bitcoin volatility index (BTC) is slightly up, just above 2.5% daily on a monthly basis, the average level of recent months.
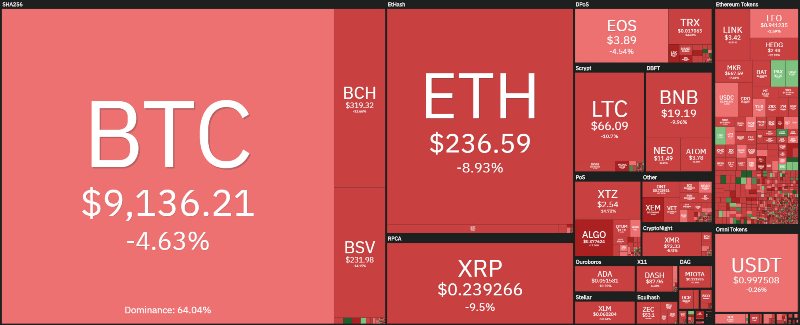
For the first time since the beginning of the year, the weekly balance of the first 35 cryptocurrencies with higher capitalization is preceded by the negative sign, declines that extend even beyond 10% as in the case of Ethereum (ETH) or Ripple (XRP): both declining between 15 and 20% on a weekly basis. Bitcoin holds better, falling back just over 9%.

The fall of the last few hours continues with prices returning to the support levels of the beginning of the month. Today is a good example of the sentiment of these days, with over 90% of cryptocurrencies in negative territory. Among the few with green signs, the best of the day is Swipe (SXP) along with Bytecoin (BCN) up 5%.
The downtrend that continues even today makes the market cap lose 15 billion dollars from yesterday’s levels and today comes close to 260 billion dollars. Volumes remain high despite the bearish context with trades over $130 billion, while Bitcoin maintains daily trades over one billion. This is the third day with the highest trading volumes since mid-January.
In a phase in which the negative sign has prevailed in recent days, Bitcoin returns to gain ground by pushing beyond the 64% dominance threshold. Ethereum is falling back to almost 10% dominance. More marked is the loss of market share of Ripple that returns close to 4%, the lowest levels in recent years already tested at the end of January.

Bitcoin (BTC) downtrend
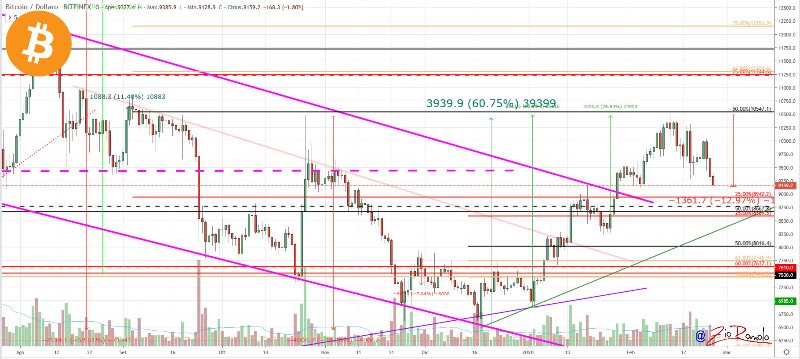
Bitcoin continues to fall and lose value, breaking the first support of $9,500 heading to test the $9,000-9,100 area. It is a 13% drop from the February 13th highs when prices touched $10,500. In case of continued bearish continuation, the next technical support is in area 8,800.
Only a break of $8,800-8,600 would trigger a first wake-up call on the medium-term bullish trend, still valid, and which started from the lows of the first days of January.

Ethereum (ETH)
Ethereum is experiencing a more intense decline. Prices return below 250 dollars with extensions that in these hours are testing the $235 area. It is a movement that sees the prices of Ethereum lose about 18% from the highs recorded in mid-February.
For Ethereum the uptrend is not compromised, but a continuation of the downward movement below $225 would give a first warning signal. For Ethereum at the moment, it is necessary to evaluate the resistance of the current levels or the next level in the $225 area.

Ripple (XRP)
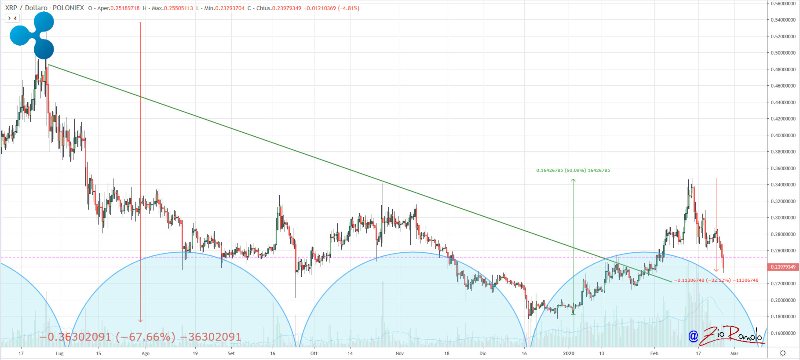
The current decline does not spare Ripple, which shows a more pronounced setback among the top three and falls below 24 cents. XRP is recording a loss in quotations from the mid-February highs that extends over 30%.
Ripple continues to show signs of fatigue and does not give any upward signs of a reversal, unlike Bitcoin, Ethereum and the altcoins. For XRP it is important to maintain the level of these hours at 24 cents, otherwise, the next support is in the 21 cents area.


