After the low of the last 10 months touched last Friday, perhaps also due to the political and economic uncertainty resulting from the Coronavirus, Bitcoin, like the rest of the industry, is alternating negative and positive days. It’s a yo-yo movement that shows how investors are trying to find some basis from where to start again.

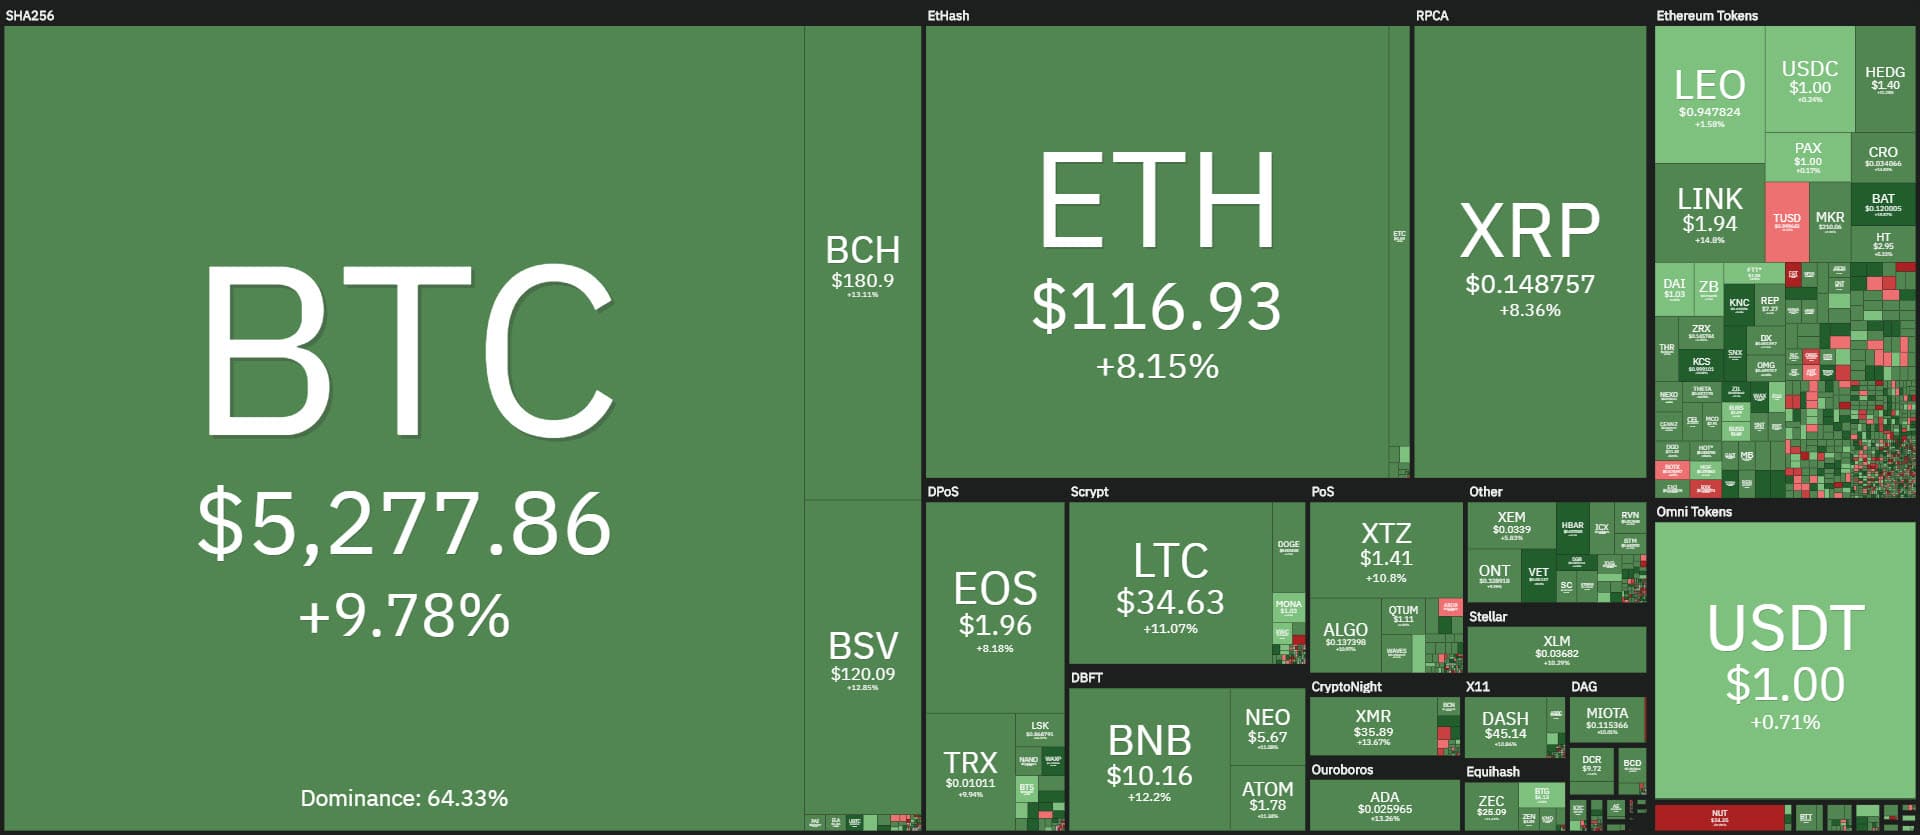
After yesterday’s negative day, green signs are emerging that prevail for 90% of the industry. Among the top 30, there are no negative signs, they are all in positive territory. Bitcoin is up 8%, followed by ETH and Ripple +6%.
Among the other big names, Bitcoin Cash (BCH) and Bitcoin Satoshi Vision (BSV) go hand in hand with +11%. Chainlink (LINK) stands out above all, with a leap that sees a recovery of 15% on a daily basis that adds to the reaction to the rebound from the lows reached last night, recovering more than 40% after the sinking that from the high at the beginning of March saw the price fall by about 70% to the lowest level recorded since June 2019.
LINK, with today’s jump, tries again to recover positions going back to the 13th place, despite the fact that yesterday it was down at the 18th place, abandoning the 11th position in the ranking reached and conquered last week after the strong rise that had characterized it from the beginning of January to the top of 10 days ago with a rally of 200%, a rally cancelled in this last week with the recent collapse.
Yesterday was characterized by strong volumes on Bitcoin. With more than 2.5 billion in counter-value in dollars traded on the main exchanges, BTC closes the most eventful day with the highest volumes, recorded also on February 26th, with a peak that had not been recorded since last October, when volumes touched the 3 billion dollars in counter-value.
Even though the end of October the price of Bitcoin was about 9,000 dollars, which means that the countervalue was higher because of a higher price. So it is the second-highest day for number of Bitcoins traded, as countervalue is lower both in October and February.
The pressure is affecting all the assets, so much so that Bitcoin, after a brief disconnection from the correlation of last week when gold was falling, returns to bind with the movements of gold.
Gold closed the week with a bearish movement of about 10%, the most negative week in 37 years, a decline that extended even further in the day yesterday with a -14% from the highs recorded a week ago, on March 9th. These are therefore really high voltage days that are showing very high volatility in the stock markets.
Yesterday, the US VIX closed the most volatile day in history, closing higher than the days of 2008, in the middle of the Lehman Brothers crisis. Volatility that also erupts on Bitcoin. In the last few days, BTC’s volatility index has multiplied eight times the reference value.
The daily volatility on a monthly basis is close to 10%, a peak that has not been recorded since January 2014, and is the obvious indicator of how movements are under attack, conditioned by irrationality and fear as reported in recent days.
This tension is evident through a fear & greed index that has been falling from its lowest levels since August 2019. As for the stock markets, it is expected that the cryptocurrency markets will stabilize their fluctuations, highlighting a period of uncertainty and nervousness.
The market cap is over $150 billion. The dominance of Bitcoin remains stable at 64%, while that of Ethereum continues to fall today going to score 8.5% dominance, the lowest level since early February.
In the meantime Ripple, despite the strong descent with the lows on Friday, has reached 10 cents, the lowest level since May 2017, XRP’s dominance is back to 4.3%. This highlights how the altcoins are suffering particularly from the recent declines.

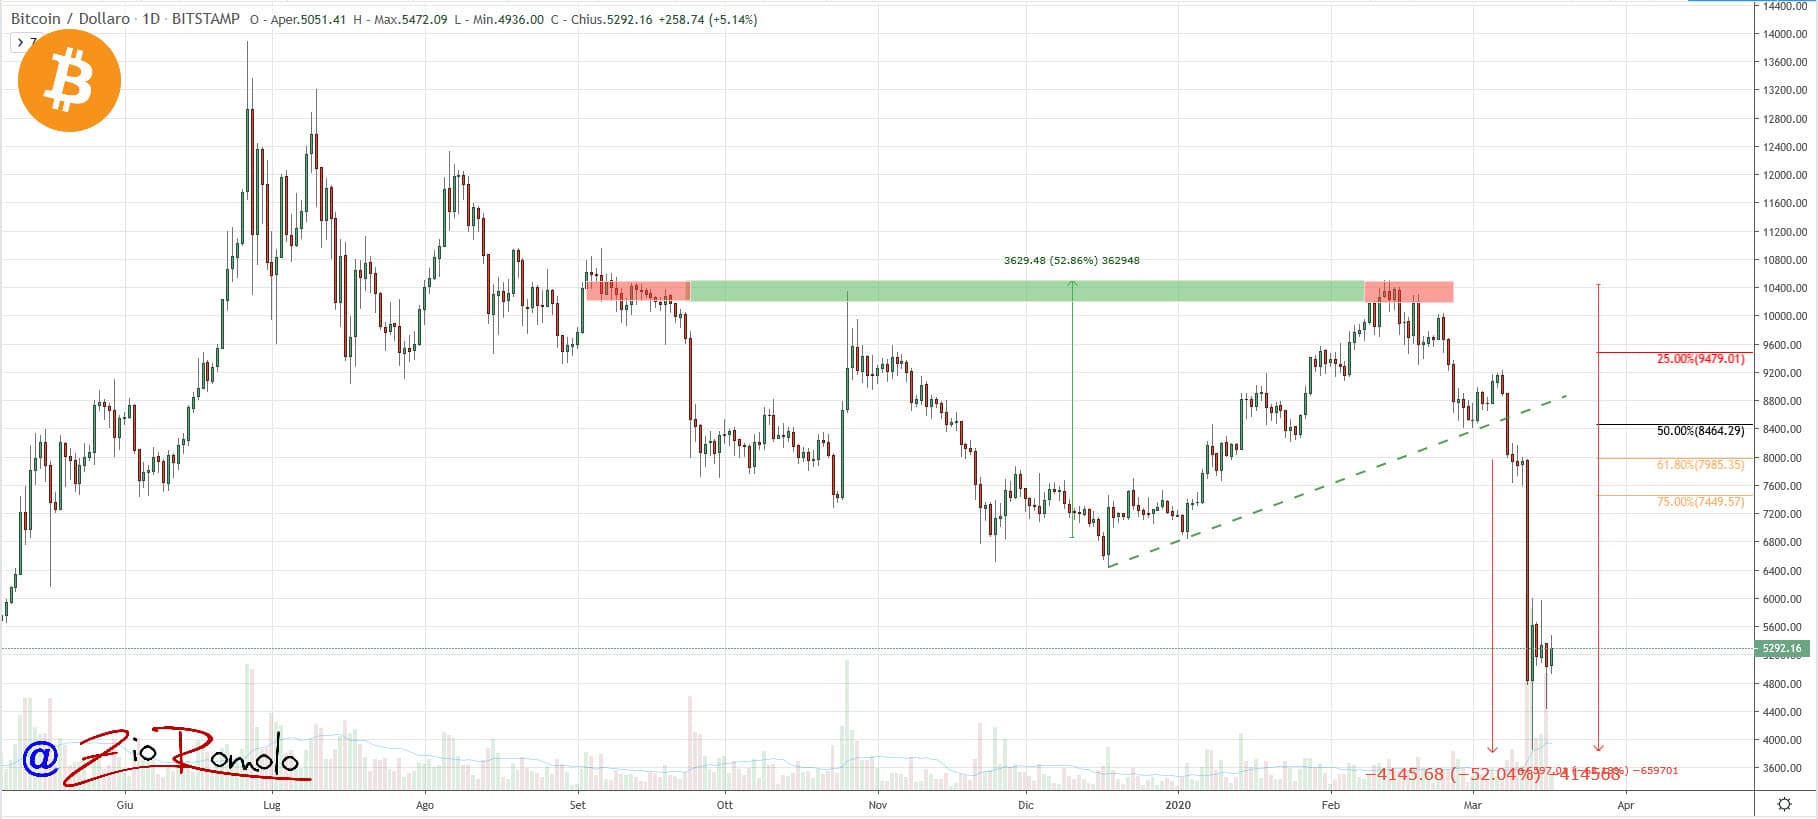
Bitcoins (BTC) and prices during Coronavirus
After diving under $4,500 yesterday, Bitcoin is now trying to push above the relative highs of the $5,500 weekend. This range 4,500-5,500 are the levels where prices could consolidate to return to hit above $6,000, levels that have characterized the price rebounds.

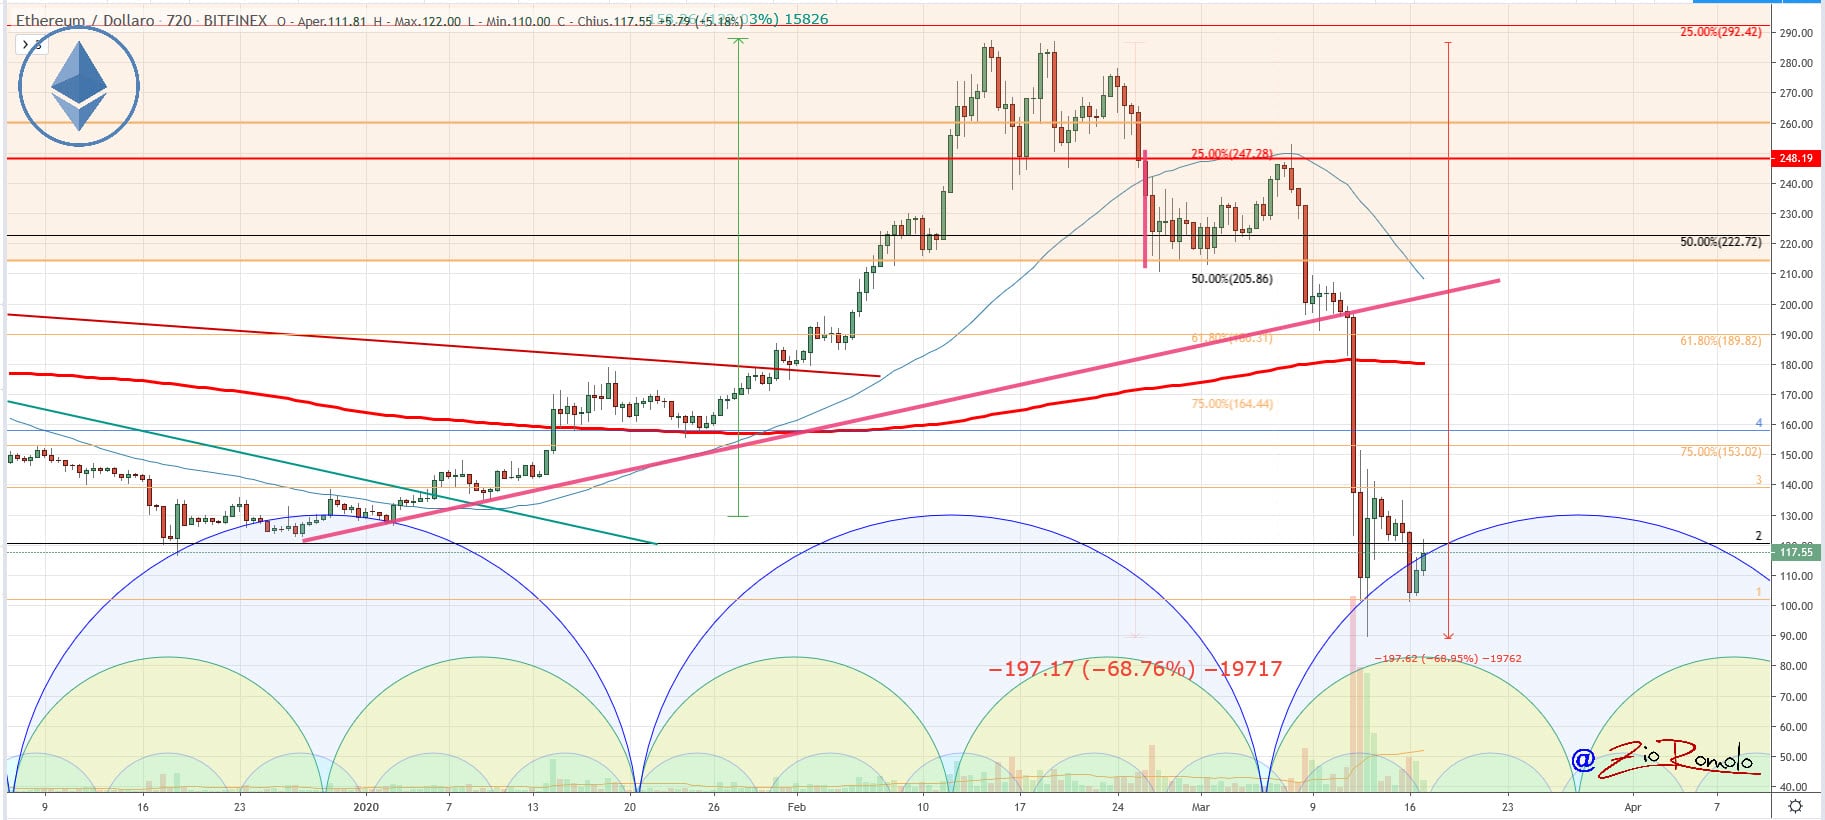
Ethereum (ETH)
Ethereum didn’t spare a drop last Friday that totally cancelled out the bullish trend it had built up during the first part of the quarter, pushing below the December 2018 lows of under $90.


