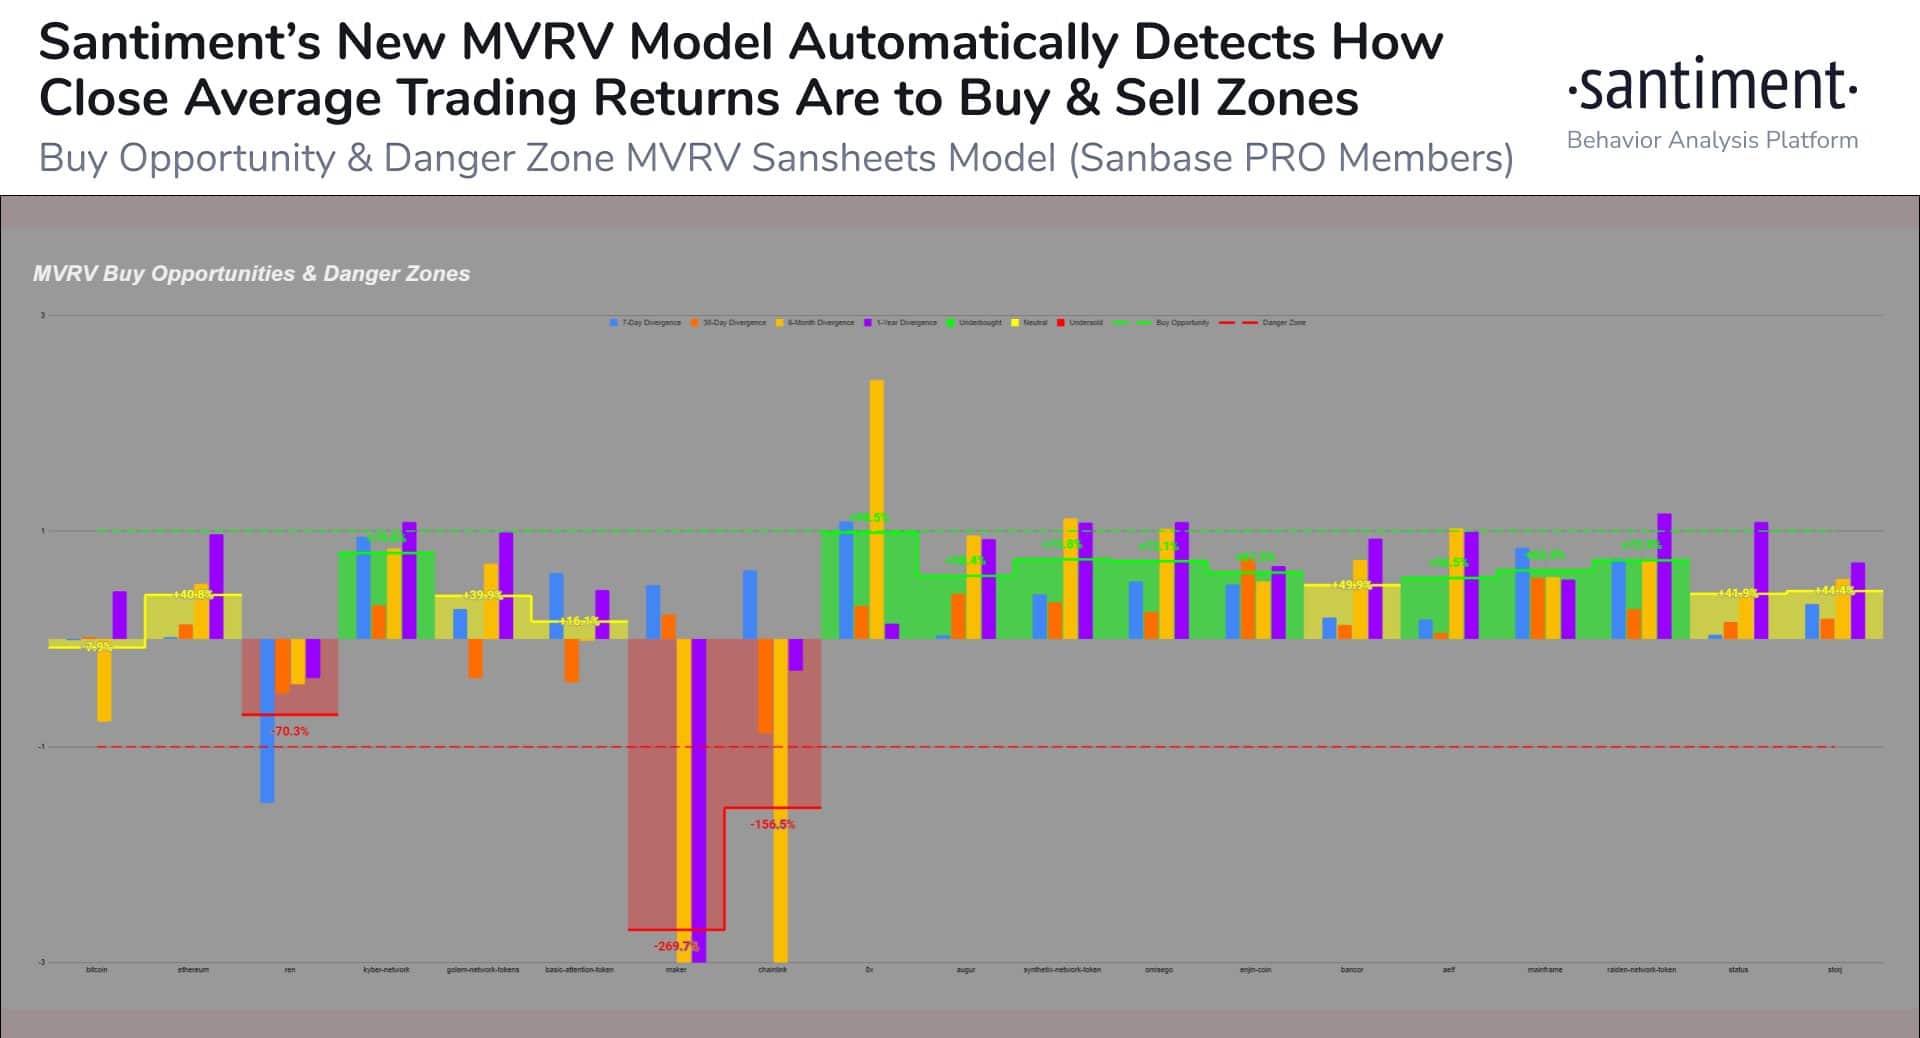
Santiment has announced a new feature that says when it might be best to buy or sell bitcoin.
📢 We're proud to announce our new MVRV model that automatically measures how close an asset is to a "danger zone" (expected sell point) or "opportunity zone" (expected buy point), using average trader returns from various timeframes. Read all about it! 📰https://t.co/0M8skmI1js pic.twitter.com/Ri9qa3ctEj
— Santiment (@santimentfeed) October 28, 2020
This is the so-called MVRV model, which automatically measures how close an asset is presumably to a “danger zone” (i.e. a possible point of sale) or an “opportunity zone” (possible point of purchase).
The model is relatively complex, and not easy to understand for those who are not engaged in trading, but the result is a fairly simple chart in which a red area is highlighted, when the price is in a danger zone, or a green area when it is in an opportunity zone.

According to what Santiment stated, this model reveals the sentiment towards a given asset at a precise moment and mathematically measures the probability of future price movement.
Buying or selling Bitcoin: red and green zones
The so-called “danger zone” occurs when traders’ average returns become too high and too fast, indicating that the asset is becoming overvalued.
The concept of “opportunity zone”, on the other hand, is the opposite end of the danger zone within this model.
This technique can be applied to the price of any asset of which the relative data necessary to carry out these calculations are available, and in particular it can be applied to cryptocurrencies.
The graph also shows two dotted lines, a green one representing the opportunity zone, and a red one representing the danger zone: the more the maximum level of the green area approaches or exceeds the green dotted line the greater the buying opportunities should be, conversely the more the minimum level of the red area approaches or exceeds the red dotted line the greater the selling opportunities should be.
For example, according to yesterday’s data, Maker (MKR) and Chainlink (LINK) are now fully in the danger zone, probably due to the incredible returns generated recently.
BTC and ETH would be slightly in the green zone, but not yet above the dotted line.
This model will be further optimized and innovated in the future, for example by introducing historical MVRV thresholds, and is actually only one of many metrics that Santiment uses. Furthermore, it is only available to users of the PRO version.
However, it should be pointed out that this metric alone does not give any certainty about whether money can be made by buying in an opportunity zone and selling in a danger zone. It should only be taken as an indication of the probability of this happening.


