Bitcoin trend
The last 24 hours have been a roller-coaster ride for bitcoin, bitcoiners and the alt coin market that’s still at the whim of the king of the cryptocurrency sector.
Around 1:00 PM UTC on Tuesday extreme selling pressure came into the market and bitcoin sold-off massively. The BTC price dipped as low as $29,247 and then recovered back above $33,000 before the day’s final 4HR candle began.
On Tuesday it was the first time BTC spent time below $30,000 since January of this year.
There are some serious whales splashing around in the crypto sector currently and the days of high volatility are back and maybe here to stay.
On Tuesday figures were released in the U.S. that categorize inflation at its worst rate in over 13 years at 5%.
After nearly two months of price action to the downside the potential that BTC hit the coveted Wyckoff Accumulation spring on Tuesday in conjunction with the inflation news is hope for bulls.
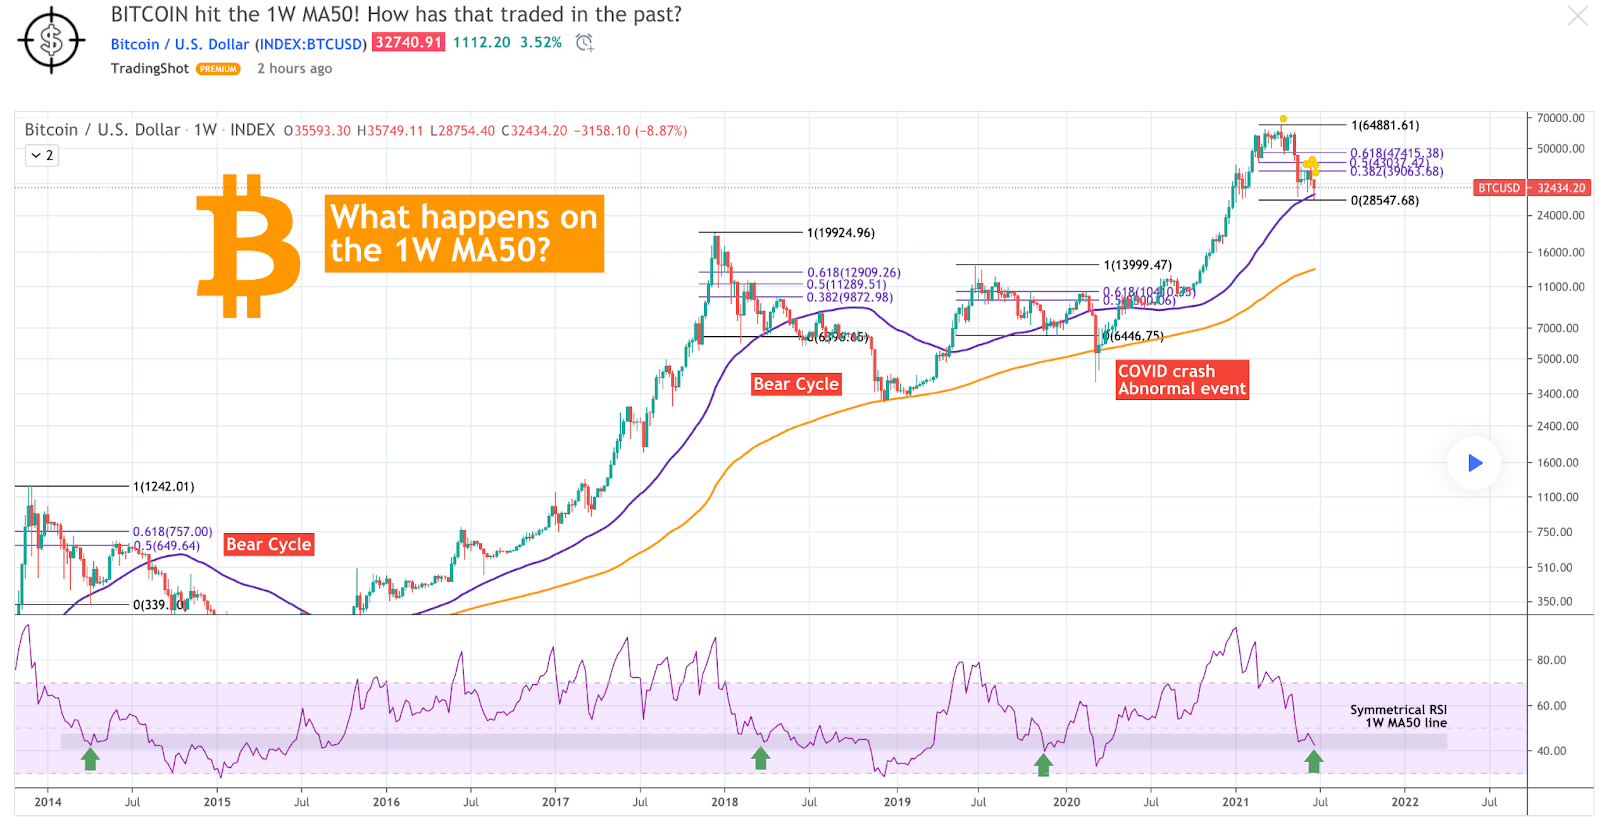
There’s also a very hopeful scenario below laid out by TradingShot that shows what has happened historically when BTC’s hit the 1W MA50.

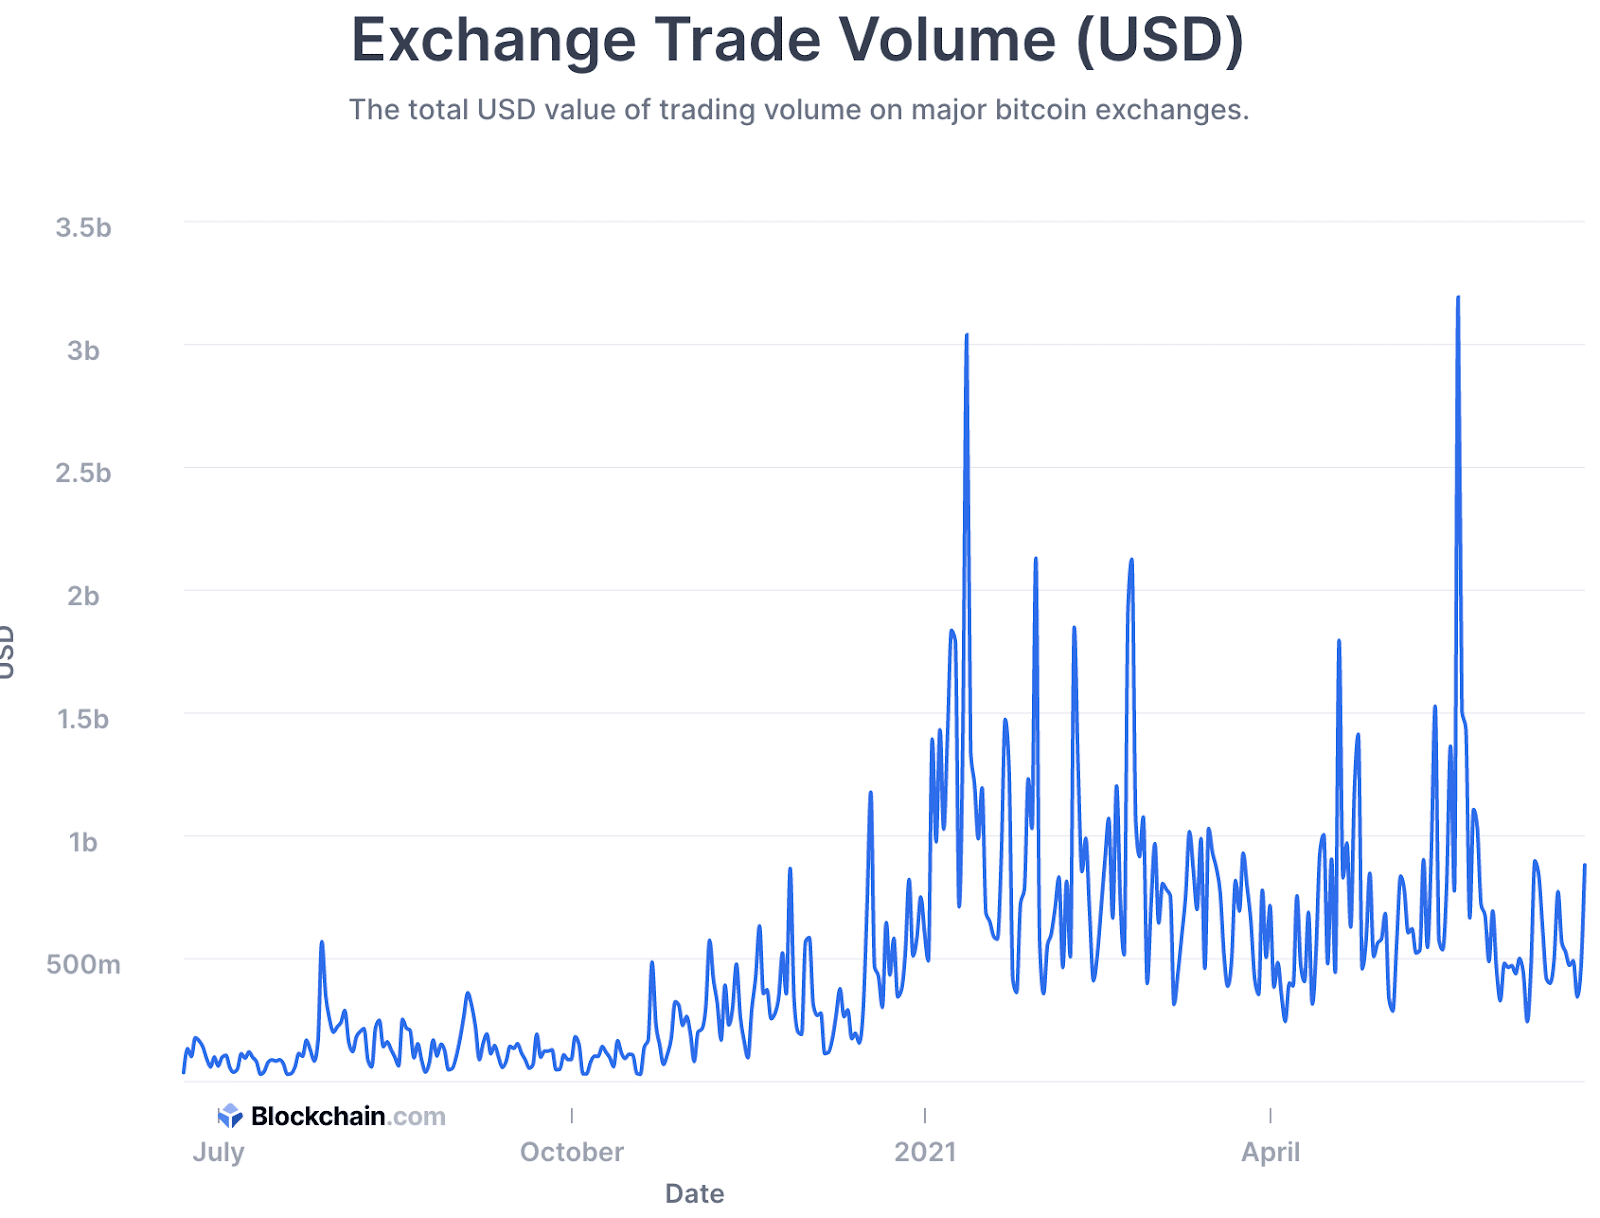
There was more bitcoin volume [$881.72m] on Tuesday than any other day since June 9th. The Blockchain.com chart below tracks the sum of the volume of the BTC / USD pair over each day.

BTC is -48.5% from it’s all-time high of $64,804 made 70 days ago on April 14th.
The bearish BTC case plays out when bears continue on with the ball and manage to push the price back below $30k for a close on a significant timescale.
BTC is +$23,076 for the last 12 months at the time of writing. BTC dominance is +9% since hitting the bottom at 37.4% just 36 days ago.
Bitcoin closed Tuesday’s daily candle worth $32,460 and $1,066 above Monday’s candle close of $31,394.
Matic
Polygon, [-11.6%] dipped below $1 for the first time since May 10th on Tuesday before bouncing hard and back above $1.10 heading into the day’s final 4HR candle.
The 24hr range for Polygon is $.929-$1.23 and it closed in red figures for a second consecutive day on Tuesday.
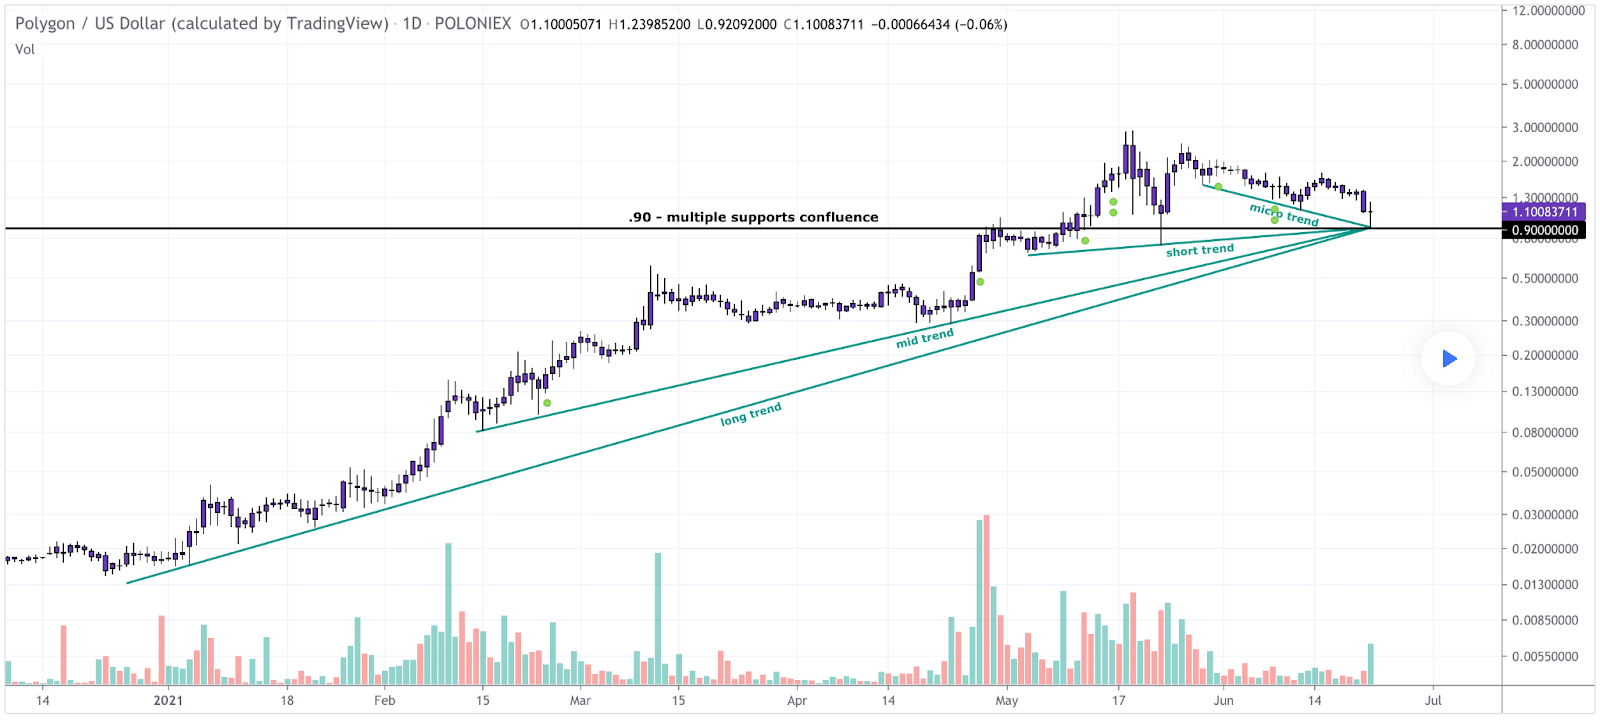
This 1D Chart from GJMRealEstate paints Matic’s long-term trend intact but hanging on just barely.

The bullish case for Matic laid out above is to stay above $.9 on the long-term trendline.
The bearish case would be dropping back below $1 and closing below that level or beneath the long-term trendline on the daily that dates back to before 2021 even began.
Matic was $.022 on this date last year and has been a major benefactor of Ethereum’s ongoing scaling battle.
Matic had a daily candle close of $1.07 on Tuesday.


