Summary
Bitcoin Analysis
Bitcoin’s price closed its daily session in green figures for a seventh consecutive day and +$269 on Monday.
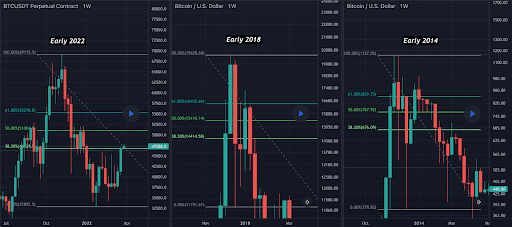
The first chart we’re analyzing today is the BTC/USD 1W chart below from NeutronMan.
Traders can see that after BTC’s price made its new all-time high in 2013 and also in 2017 there was a steep sell-off followed by a price rally back above the 61.8% fib level in 2014 and 50.00% fib level in 2018.
On the chart pictured first on the left, the 2022 chart, we can see that BTC’s price is now back above the 38.20% fib level, at the time of writing. If history repeats and this is a relief rally in a bear market, the two price levels with special emphasis for observers are 50.00% [$51,004.] and 61.80% [$55,278.0].

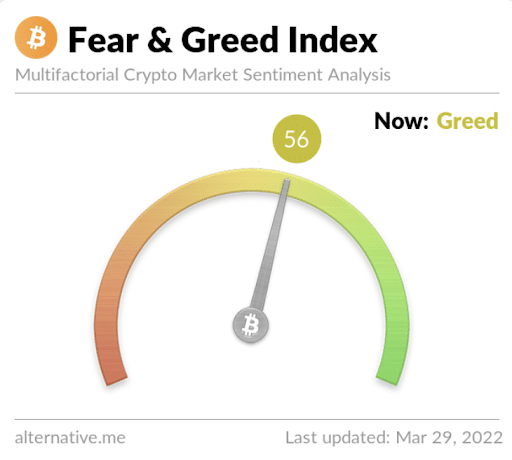
The Fear and Greed Index is 56 Greed and is -4 from Monday’s reading of 60 Greed.

Bitcoin’s Moving Averages: 5-Day [$44,213.79], 20-Day [$41,497.58], 50-Day [$40,588.44], 100-Day [$46,076.52], 200-Day [$45,983.84], Year to Date [$41,088.85].
BTC’s 24 hour price range is $46,660-$48,078 and its 7 day price range is $41,061-$48,078. Bitcoin’s 52 week price range is $29,341-$69,044.
The price of bitcoin on this date last year was $57,634.
The average price of BTC for the last 30 days is $41,513.
Bitcoin’s price [+0.57%] closed its daily candle worth $47,105 on Monday.
Ethereum Analysis
Ether’s price also was sent higher during its daily candle on Monday and concluded its daily session +$33.55.
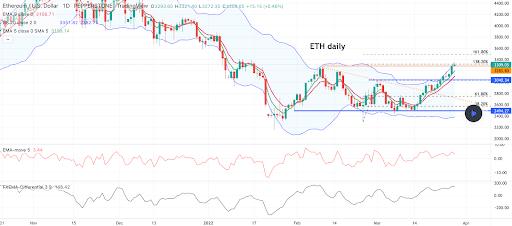
The ETH/USD 1D chart below by Pepperstone shows ETH’s price trading between the 61.80% fib level [$2,744.98] and the 138.20% fib level [$3,315.23], at the time of writing.
ETH’s price is bumping up against the top of its current range at the 138.20% fib level and Ether bulls are looking at the next overhead target of 161.80% [$3,494.99] as a secondary target.
Conversely, bearish BTC traders are looking to reject bulls at 138.20% and send ETH’s price back down to test the $3k level before an eventual secondary target of 61.80%.

Ether’s Moving Averages: 5-Day [$3,119.04], 20-Day [$2,822.86], 50-Day [$2,814.08], 100-Day [$3,417.09], 200-Day [$3,249.22], Year to Date [$2,916.47].
ETH’s 24 hour price range is $3,272-$3,421 and its 7 day price range is $2,895-$3,421. Ether’s 52 week price range is $1,687-$4,878.
The price of ETH on this date in 2021 was $1,817.
The average price of ETH for the last 30 days is $2,827.
Ether’s price [+1.02%] closed its daily candle on Monday worth $3,329.2 and in green figures for the thirteenth time over the last fifteen days.
Avalanche Analysis
Avalanche’s price traded in red figures just marginally on Monday and finished its daily candle -$0.42.
The AVAX/USD 1D chart below by InevitableCrypto is trading between 2.618 [$69.11] and 4 [$92.29], at the time of writing.
Traders that are of the bullish sentiment in the Avalanche market are seeking to reach the $92 level over time if the micro climate stays bullish.
Bearish traders are obviously looking to reverse course soon and retest the 2.618 again with a secondary target of 2 [$58.75] and a third target of 1.618 [$52.34].

Avalanche’s 24 hour price range is $88.75-$95.82 and its 7 day price range is $82.96-$95.82. Avalanche’s 52 week price range is $9.33-$144.96.
Avalanche’s price on this date last year was $29.60.
The average price of AVAX over the last 30 days is $79.64.
Avalanche’s price [-0.47%] closed its daily session worth $89.56 and in red figures again for the first time in three days on Monday.


