

Summary
Bitcoin Analysis
Bitcoin’s price experienced a nice price rally by bulls just before the day’s last 4HR candle began on Wednesday and BTC’s price concluded its daily session +$1,950.2.
BTC’s price rallied soon after news broke from The Federal Reserve’s Chairman, Jerome Powell, that the Fed is raising rates by 0.5% – it’s the second time the Fed has raised interest rates this year and the largest rate hike since the year 2000.
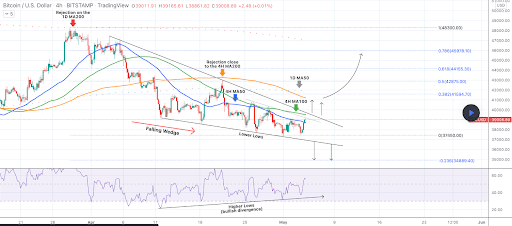
Today, we’re leading off our analysis with the BTC/USD 4HR chart below from TradingShot. BTC’s price is trading between the 0 fib level [$37,450.00] and 0.382 [$41,594.70], at the time of writing.
For bullish traders to again feel like they’re in short-term control they need to eclipse the 0.382 fib level. The next overhead obstacles for bulls are 0.5 [$42,875.00], 0.618 [$44,155.30], and 0.786 [$45,978.10].
Conversely, bearish BTC traders are looking to take bulls into deeper waters and push BTC’s price below the 0 fib level with a secondary target of 0.236 [$34,889.40].
BTC’s 24 hour price range is $37,758-$39,946 and its 7 day price range is $37,669-$40,183. Bitcoin’s 52 week price range is $29,341-$69,044.
The price of bitcoin on this date last year was $57,432.
The average price of BTC for the last 30 days is $40,585.5 and BTC is -14.5% over the same time frame.
Bitcoin’s price [+5.17%] closed its daily candle worth $39,701 and in green figures for the third time over the last four days.
Ethereum Analysis
Ether’s price also marked up in price on Wednesday and finished its daily candle +$159.09.
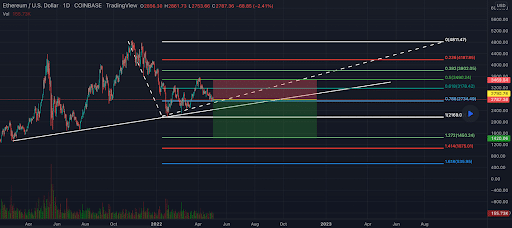
The ETH/USD 1D chart below by YL_PRO is the second chart we’re analyzing for Thursday. Ether’s price is trading between the 0.786 fib level [$2,734.49] and 0.618 [$3,178.42], at the time of writing.
The targets to the upside for bullish Ether traders are 0.618, 0.5 [$3,490.24], 0.382 [$3,802.05], 0.236 [$4,187.85], and 0 [$4,811.47].
Bearish ETH traders are trying to again crack the $2,8k level and retest the 0.786 fib. If they’re successful, bearish traders have targets to the downside of 1 [$2,169.00], 1.272 [$1,450.24], 1.414 [$1,075.01], and 1.618 [$535.95].
The price of ETH on this date in 2021 was $3,524.56.
The average price of ETH for the last 30 days is $3,024.02 and Ether’s -19.4% over the same timespan.
Ether’s price [+5.72%] closed its daily candle worth $2,940.55 on Wednesday and has also closed in green digits three times over the last four days.
Avalanche Analysis
Avalanche’s price finished above ETH and BTC by percentage gains on Wednesday and concluded its daily session +$7.62.
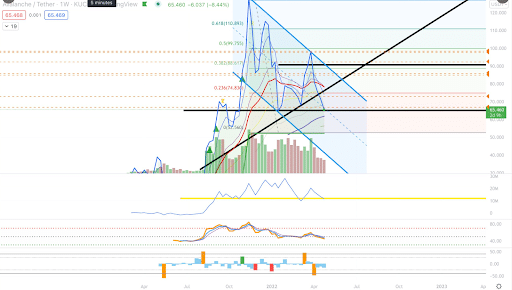
The final chart today is the AVAX/USDT 1W chart below from @EnigmaFund. Avalanche’s price is ranging between the 0.236 fib level [$74.83] and 0.382 [$88.61], at the time of writing.
AVAX’s price is in a clear downtrend and is -57.8% since its all-time high was made on November 21, 2021. So, it’s imperative for bullish AVAX traders to reclaim the 0.382 fib level before further damage is done by bears.
The targets overhead for bullish traders if they can reclaim the territory above the 0.382 are 0.5 [$99.75], and 0.618 [$110.89].
Bearish traders have obviously been in control of AVAX’s price action over the last 5 months. They’re looking to push AVAX’s price below the 0.236 fib with a secondary target of 0 [$52.56] to really inflict pain on bullish traders.
Avalanche’s price on this date last year was $35.36.
The average price of AVAX over the last 30 days is $74.65 and AVAX is -37.47% over the same duration.
Avalanche’s price [+12.78%] closed its daily candle worth $67.24 on Wednesday and also has finished in green figures for three times over the last four daily sessions.