Summary
Bitcoin Analysis
Bitcoin’s price continued trading in support purgatory between $28,8k-$31k on Wednesday. If Thursday’s candle closes around $30k that will be the 17th consecutive day that BTC’s price has hovered around the $30k level. BTC’s price concluded Wednesday’s daily session -$123.
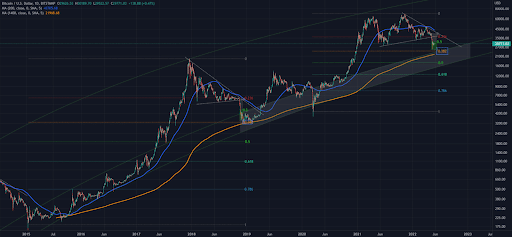
The first chart we’re analyzing today is the BTC/USD 1D chart below from @davthewave. We can see on the chart below that BTC’s price is trading comfortably below the 200D MA of $43,705.68. Will BTC’s price go and test the 200W MA at $21,968.68?
For bearish traders to take bullish traders down to test the 200W MA bearish traders need to first put behind the $30k level. Bearish traders have a secondary target of 0.382 and a third target of 0.5 to the downside.
Bullish traders need to focus on regaining the $30k level and then regain the 0.236 fibonacci level if they want to avoid a trip to the lower $20k level.

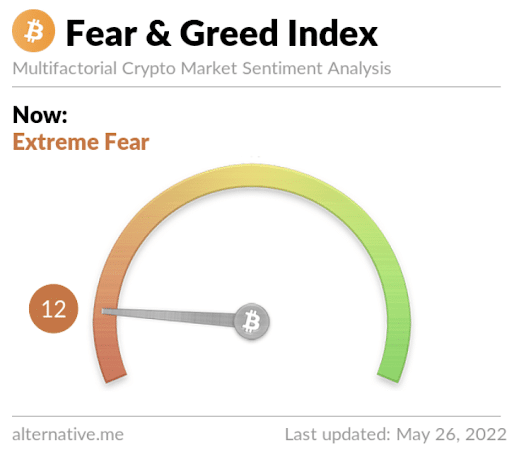
The Fear and Greed Index is 12 Extreme Fear and is +1 from Wednesday’s reading of 11 Extreme Fear.

Bitcoin’s Moving Averages: 5-Day [$29,517.84], 20-Day [$32,616.82], 50-Day [$38,568.27], 100-Day [$39,541.81], 200-Day [$46,131.45], Year to Date [$39,709.64].
BTC’s 24 hour price range is $29,399-$30,172 and its 7 day price range is $28,772-$30,546. Bitcoin’s 52 week price range is $26,600-$69,044.
The price of Bitcoin on this date last year was $39,301.
The average price of BTC for the last 30 days is $33,461.1 and BTC’s -24.9% over the same duration.
Bitcoin’s price [-0.41%] closed its daily candle worth $29,524 and back in red figures for the second time over the last three days.
Ethereum Analysis
Ether’s price closed below an important level [$1,972] on the 4HR chart on Wednesday and ETH closed its daily session -$36.49.
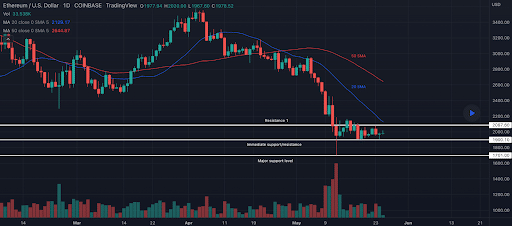
The second chart we’re looking at today is the ETH/USD 1D chart below by Tradersweekly. Ether’s price has been trading sideways nearly as long as BTC’s price. That stat may indicate a continued downtrend for Ether when coupled with decreasing volume on the hourly and daily time frame.
We can see on the chart below that ETH’s price is trading below the 50 SMA and 20 SMA.
Bullish Ether traders are holding the $1,900 level, at the time of writing. If that level breaks down bullish ETH traders should have strong support at $1,700.

Ether’s Moving Averages: 5-Day [$1,977.65], 20-Day [$2,316.27], 50-Day [$2,796.76], 100-Day [$2,823.62], 200-Day [$3,331.27], Year to Date [$2,849.29].
ETH’s 24 hour price range is $1,944-$2,017 and its 7 day price range is $1,915-$2,073. Ether’s 52 week price range is $1,719-$4,878.
The price of ETH on this date in 2021 was $2,884.17.
The average price of ETH for the last 30 days is $2,384.7 and ETH’s -33.35% over the same time frame.
Ether’s price [-1.84%] closed its daily candle on Wednesday worth $1,942.91.
Polkadot Analysis
Polkadot’s price also dipped lower by more than 3% on Wednesday and closed its daily session -$0.32.
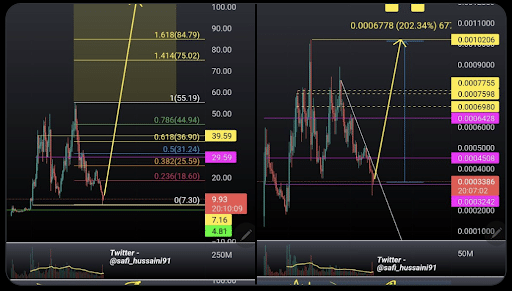
The third chart we’re analyzing today is the DOT/USD 1W chart below from @Safi_hussaini9. Traders will note that DOT’s price is trading between a full retracement at the 0 fibonacci level [$7.30] and 0.236 [$18.60].
The overhead targets for bulls are 0.236, 0.382 [$25.59], and 0.5 [$31.24].
The primary goal of bearish DOT traders is to push DOT’s price below the 0 fib level over the interim.

We can see that DOT’s price is trying to break out to the upside against BTC’s price and is potentially painting a bull flag. DOT’s price made its all-time high only 6 days before BTC’s ATH was made. DOT’s price however is -84% from its ATH and BTC’s price is -56.9% from its ATH, at the time of writing.
Polkadot’s 24 hour price range is $9.85-$10.31 and its 7 day price range is $9.35-$10.62. DOT’s 52 week price range is $7.31-$54.98.
Polkadot’s price on this date last year was $24.49.
The average price of DOT over the last 30 days is $12.6 and DOT’s -45.6% over the same timespan.
Polkadot’s price [-3.14%] closed its daily session on Wednesday worth $9.87.


