

Bitcoin Analysis
The cryptocurrency market is currently highly illiquid and bullish market participants were able to take advantage of that fact over the weekend and sent BTC’s price higher. When traders settled-up to close Sunday’s trading session, BTC’s price was +$366.8.
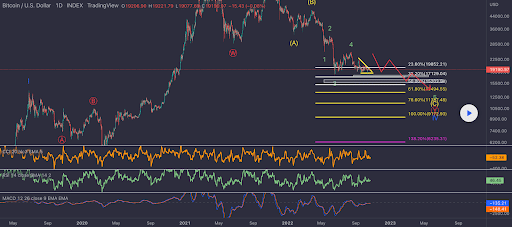
We’re beginning a new week of price analyses with the BTC/USD 1D chart below from Naphat_DD. BTC’s price is trading between the 38.20% fibonacci level [$17,129.04] and 23.60% fib level [$19,852.21], at the time of writing.
The primary overhead target on BTC’s price for BTC bulls is the 23.60% fib level. If they can reclaim that level and push BTC’s price just a bit higher then bullish traders will again be in control of the price action and again above BTC’s most critical level of inflection [$19,891].
Conversely, bearish traders that still want to see further downside on the number one asset in the sector by market capitalization have targets below of 38.20%, 50.00% [$15,203.58], 61.80% [$13,494.55], 78.60% [$11,387.48], 100.00% [$9,172.93], and 138.20% [$6,235.31].
Bitcoin’s Moving Averages: 5-Day [$19,271.31], 20-Day [$19,428.33], 50-Day [$20,164.32], 100-Day [$21,388.49], 200-Day [$30,023.19], Year to Date [$30,666.12].
BTC’s 24 hour price range is $19,070.01-$19,695 and its 7 day price range is $18,788.33-$19,695. Bitcoin’s 52 week price range is $17,611-$69,044.
The price of Bitcoin on this date last year was $60,847.
The average price of BTC for the last 30 days is $19,356.4 and the asset’s +6% for the same interval.
Bitcoin’s price [+1.91%] closed its daily candle on Sunday worth $19,571.2 and in green figures for a third consecutive day.
Summary
Ethereum Analysis
Ether’s price also marked up for a third straight day on Sunday and ETH’s price was sent $50.57 higher by bulls.
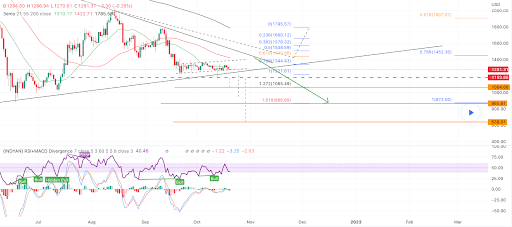
The second chart we’re analyzing today is the ETH/USD 1D chart by trieisdi9. Ether’s price is trading between 0.786 fibonacci level [$1,344.43] and 0.618 [$1,440.86], at the time of writing.
Bullish Ether market participants are hoping like BTC bulls that ETH can make a move to reclaim its 2017 ATH above the $1,400 level. The fib targets above that level are 0.618, 0.5 [$1,508.59], 0.382 [$1,576.32]. 0.236 [$1,660.12], and a full retracement at the 0 fib level [$1,795.57].
At variance with those going long on the Ether market are bearish traders that want to again send ETH’s price below the 0.786 fib level followed by targets of 1 [$1,22.61], 1.272 [$1,065.49], and 1.618 [$866.89].
ETH’s 24 hour price range is $1,299.44-$1,371.55 and its 7 day price range is $1,264.48-$1,371.55. Ether’s 52 week price range is $883.62-$4,878.
The price of ETH on this date in 2021 was $4,083.18.
The average price of ETH for the last 30 days is $1,315.64 and its +9.67% over the same stretch.
Ether’s price [+3.85%] closed its trading session on Sunday worth $1,364.19.
Matic Analysis
Matic’s price was the top performer of the projects covered today and when the day’s candle was painted, MATIC was +$0.067.
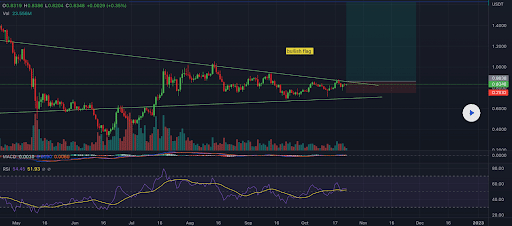
The final chart to wrap-up Monday’s price analysis is the MATIC/USD 1D chart below from dubai_kingpin.
Matic’s price has been consolidating between $0.62-$1.05 dating back to the middle of July. We can see on the daily timescale that Matic’s price was forming a bull flag and only needed confirmation by bulls with a breakout of the pattern.
Bullish traders confirmed that breakout after months of consolidation during Sunday’s daily session and bullish Matic market participants sent Matic’s price above the $0.8498 level with candle close confirmation.
If bearish traders have their way they’ll reject bullish Matic market participants and generate a false breakout before a retest of the bottom of the structure at $0.62.
Matic’s Moving Averages: 5-Day [$0.855], 20-Day [$0.813], 50-Day [$0.823], 100-Day [$0.751], Year to Date [$0.875].
Polygon’s 24 hour price range is $0.82-$0.908 and its 7 day price range is $0.789-$0.908. Matic’s 52 week price range is $0.317-$2.92.
Polygon’s price on this date last year was $1.57.
The average price of MATIC over the last 30 days is $0.8 and its +28.01% for the same time frame.
Matic’s price [+8.13%] closed its daily candle on Sunday valued at $0.899 and in green figures again after it closed Saturday in negative figures.