Bitcoin Analysis
Bitcoin’s price marked-down for a fourth consecutive day on Sunday but bullish traders can rejoice in the fact that over those four days the cumulative price drop was only 1.21%. When traders settled-up on BTC for Sunday’s session to close the week, BTC’s price was -$30.4.
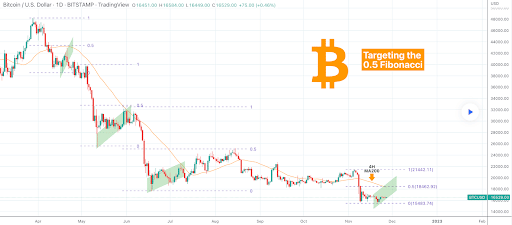
The BTC/USD 1D chart by TradingShot is the first chart we’re analyzing for this Monday. BTC’s price is trading between the 0 fibonacci level [$15,483.74] and 0.5 fib level [$18,462.92], at the time of writing.
The primary target for bullish BTC market participants is the 0.5 fib level which is also the 4HR MA 200. If bullish traders can regain that level on two important high time frames then they can shift their focus to the 1 fib level [$21,442.11].
Bearish BTC traders are conversely attempting to continue their momentum as they’ve controlled the majority of the price action in 2022. Their first fib target to the downside is the 0 fibonacci level which is a retest of BTC’s multi-year low.


Bitcoin’s Moving Averages: 5-Day [$16,258.07], 20-Day [$17,828.51], 50-Day [$18,839.68], 100-Day [$20,294.00], 200-Day [$27,264.61], Year to Date [$29,352.22].
BTC’s 24 hour price range is $16,415-$16,600 and its 7 day price range is $15,665-$16,753. Bitcoin’s 52 week price range is $15,501-$59,174.
The price of Bitcoin on this date last year was $57,325.
The average price of BTC for the last 30 days is $18,240.4 and its -17.7% over the same interval.
Bitcoin’s price [-0.18%] closed its daily candle worth $16,426.5 on Sunday.
Ethereum Analysis
Ether’s price also traded lower at Sunday’s close than at the session’s open but ETH’s finished in green figures for 5 of the last 7 days. When Sunday’s candle was printed, ETH’s price was in negative digits however and -$11.79.
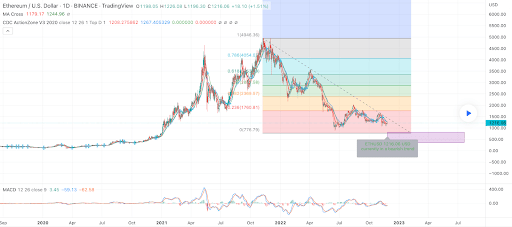
The second chart we’re analyzing today is the ETH/USD 1D chart from Supaset. At the time of writing, ETH’s price is trading between the 0 fib level [$776.79] and 0.236 [$1,760.81].
Bullish ETH market participants firstly need to claim the $1,448 level again which was ETH’s 2018 ATH. If they can get above that level, their targets are the following; 0.236, 0.382 [$2,369.57], 0.5 [$2,861.58], 0.618 [$3,359.59], 0.786 [$4,054.07] and the 1 fibonacci level [$4,946.36] which is ETH’s ATH on Binance’s daily chart.
Bearish traders want to retest ETH’s multi-year low of $776.79 in time and continue to dictate Ether’s price action heading into 2023 in just over a month.

ETH’s 24 hour price range is $1,188.65-$1,223.33 and its 7 day price range is $1,082.89-$1,223.33. Ether’s 52 week price range is $883.62-$4,778.
The price of ETH on this date in 2021 was $4,297.52.
The average price of ETH for the last 30 days is $1,354.28 and its -16.77% over the same period.
Ether’s price [-0.98%] closed its daily session on Sunday worth $1,193.35.
CRO Analysis
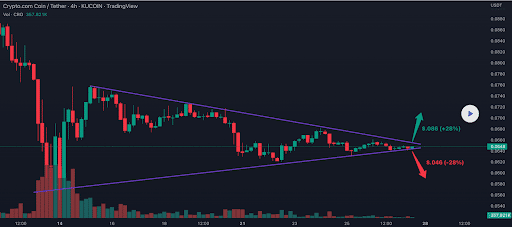
The CRO/USD 4HR chart below from BigBCFinance is the chart we’re looking at lastly to wrap-up Monday’s price analyses.
CRO’s price action over the last two weeks has yielded a triangle pattern that looks to be nearing the end of its formation.
The chartist denotes that market participants could be looking at a measured move of 28% either to the upside or downside in coming days.
If bulls break out to the upside and it appreciates 28% that would bring CRO’s price to the $0.086 level.
Contrariwise, a measured move by bearish traders upon a break out to the downside is the $0.046 level.

CRO’s Moving Averages: 5-Day [$0.06512], 20-Day [$0.08388], 50-Day [$0.09862], 100-Day [$0.11385], Year to Date [$0.17742].
Crypto.com’s 24 hour price range is $0.0642-$0.0651 and its 7 day price range is $0.06288-$0.06843. The 52 week price range of Cronos is $0.0543-$0.7758.
Crypto.com’s price on this date last year was $0.7499.
CRO’s average price over the last 30 days is $0.0892 and its -40.68% over the same stretch of time.
Crypto.com’s price [-0.46%] closed its daily session on Sunday valued at $0.0643 and in red figures for a fourth straight day.


