Bitcoin Analysis
Bitcoin’s price took a step back on Wednesday and when traders concluded for the daily session, BTC’s price was -$252.
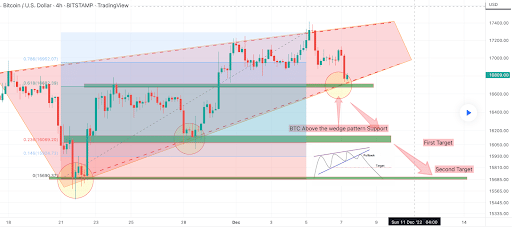
The first chart we’re looking at today is the BTC/USD 4HR chart below from bOnchain. At the time of writing, BTC’s price is trading between the 0.618 fibonacci level [$16,682.39] and 0.786 [$16,952.07].
If bullish traders can regain the 0.786 fibonacci level their next target is to break out of the current wedge pattern that BTC’s price is trading within at the $17,366.87 level.
Bearish BTC traders are at variance with bullish ones and hoping to break out of the wedge pattern to the downside and short BTC’s price outside of the pattern and below the $16,739.31 level. Below that level those short BTC’s market have targets of 0.618, 0.236 [$16,069.20], 0.146 [$15,924.73], and a full retrace at 0 [$15,690.37].


Bitcoin’s Moving Averages: 5-Day [$16,949.63], 20-Day [$16,676.13], 50-Day [$18,464.16], 100-Day [$19,947.33], 200-Day [$26,339.56], Year to Date [$28,939.43].
BTC’s 24 hour price range is $16,701-$17,156 and its 7 day price range is $16,701-$17,362.29. Bitcoin’s 52 week price range is $15,501-$52,027.
The price of bitcoin on this date last year was $50,503.4.
The average price of BTC for the last 30 days is $16,988 and its -21% over the same stretch.
Bitcoin’s price [-1.47%] closed its daily candle worth $16,844 on Wednesday.
Summary
Ethereum Price Analysis
Ether’s price also marked-down on Wednesday and concluded its daily trading session -$40.22.
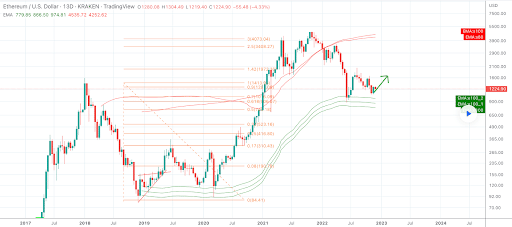
The ETH/USD 13D chart via Cryptoer_Lion is the second chart we’re analyzing for this Thursday. Ether’s price is trading between the 0.7 fibonacci level [$1,015.09] and the 0.9 fib level [$1,281.00], at the time of writing.
The overhead targets on ETH for bullish traders that believe upside is next are 0.9, 1 [$1,413.96], 1.42 [$1,972.36], 2.5 [$3,408.27], and the 3 fibonacci level [$4,073.04].
Contrariwise, those that are still shorting the ETH market have a primary target of the 0.7 fib level with targets below that level of 0.618 [$906.07], 0.5 [$749.18], 0.33 [$523.16], 0.25 [$416.80], 0.17 [$310.43], 0.08 [$190.78], and a full retracement at 0 [$84.41].

ETH’s 24 hour price range is $1,218.01-$1,278.69 and its 7 day price range is $1,218.01-$1,302.22. Ether’s 52 week price range is $883.62-$4,482.76.
The price of ETH on this date in 2021 was $4,435.24.
The average price of ETH for the last 30 days is $1,246.47 and its -24.07% for the same interval.
Ether’s price [-3.16%] closed its daily session on Wednesday worth $1,231.03
Litecoin Price Analysis
Litecoin’s price followed the macro cryptocurrency sector backwards on Wednesday and when traders settled-up at the daily session’s close, LTC’s price was -$3.05.
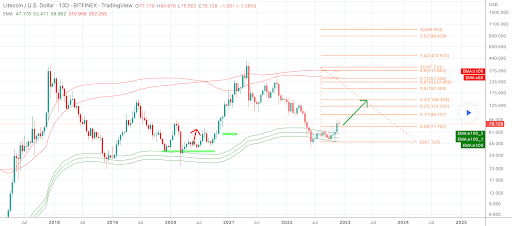
The LTC/USD 13D chart below from Cryptoer_Lion is the final chart for analysis this Thursday. LTC’s price is trading between the 0.08 fibonacci level [$71.152] and 0.17 fib level [$98.207], at the time of writing.
The overhead targets for bullish traders of Litecoin’s market are 0.17, 0.25 [$122.255], 0.33 [$146.304], 0.5 [$197.408], 0.618 [$232.880], 0.7 [$257.530], 0.9 [$317.652], and the 1 fib level [$347.713].
Bearish LTC traders have targets to the downside of 0.8 and a full retracement at the 0 fib level [$47.103].

Litecoin’s price on this date last year was $165.00.
The average price of LTC over the last 30 days is $68.6 and its +10.75% over the same interval.
Litecoin’s price [-3.82%] closed its daily candle on Wednesday worth $76.85 and in red figures for a second consecutive day.


