

Micron Stock (MU) has surged far beyond expectations, trading at $1,064 on June 2, well above key moving averages across all timeframes. While the daily trend remains strongly bullish, momentum indicators signal an overbought condition that warrants caution for new entries.
Summary
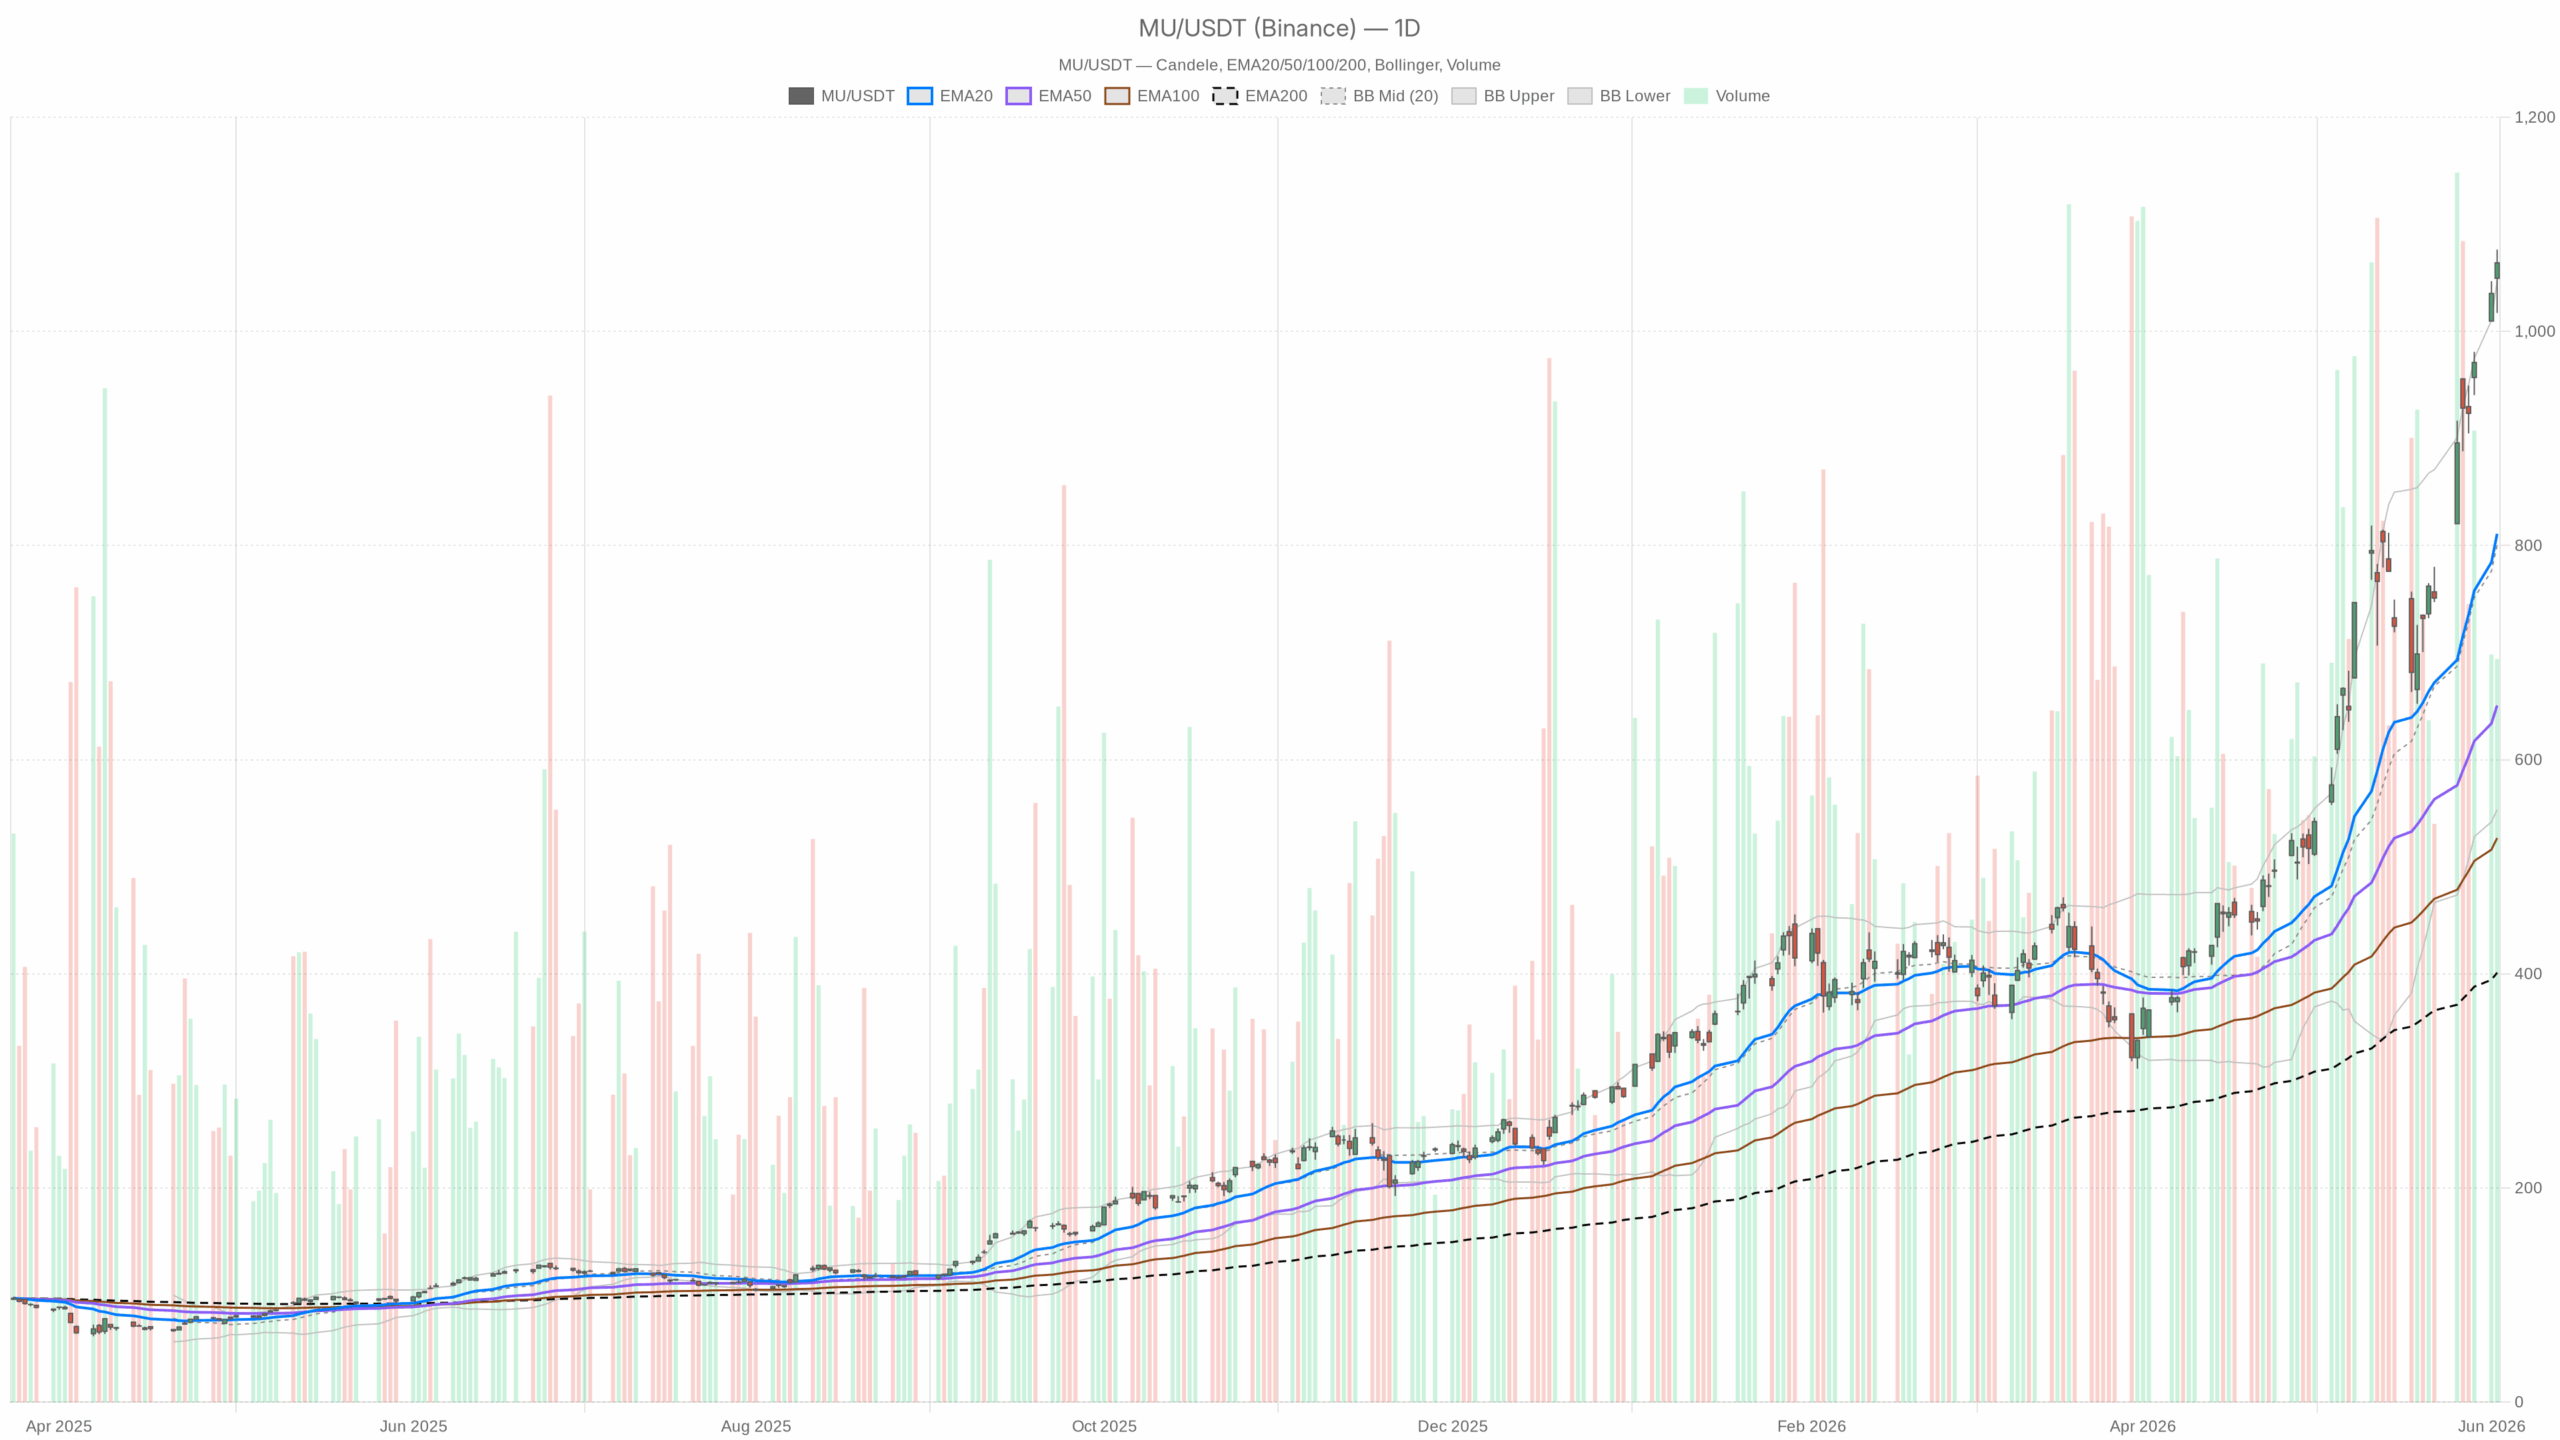
Micron Stock Daily Timeframe: Clear Uptrend but Overextended
On the daily chart, MU closed at $1,064.10, reaching an intraday high of $1,076.52. The exponential moving averages (EMAs) confirm robust bullish control: price exceeds the EMA20 at $811, EMA50 at $650, and EMA200 at $401. This shows sustained buying pressure over short and medium terms.
Yet, the daily Relative Strength Index (RSI) stands at 81.8, deep into overbought territory. Although this does not guarantee an immediate reversal, it indicates heightened risk for sharp pullbacks. The daily MACD line at 119.82 remains above its signal at 96.45, with an expanding positive histogram of 23.38, supporting the ongoing uptrend.
The daily Bollinger Bands further highlight volatility extremes. MU closed above the upper band, situated at $1,047.58, signaling a breakout scenario that often precedes trend continuation rather than reversal. The average true range (ATR) on the daily timeframe, at $63.09, reflects substantial daily price swings, advising prudent position sizing.
Daily pivot points set the pivot at $1,052.63, resistance 1 (R1) at $1,087.99, and support 1 (S1) at $1,028.74. The stock is maintaining levels above the pivot, preserving a constructive short-term structure.
Micron Stock Hourly Timeframe: Momentum Softens Slightly
Hourly data aligns with the bullish daily trend but reveals some momentum weakening. MU closed at $1,064.08 with EMAs stacked positively below—EMA20 at $1,016.50, EMA50 at $942.76, and EMA200 at $745.80—yet price runs significantly ahead of these averages.
Importantly, the hourly MACD line has just slipped below its signal line, registering at 37.18 versus 38.50, and the histogram reads -1.31. This subtle shift suggests short-term momentum has softened, although the trend remains intact. The hourly RSI at 79.1 confirms ongoing overbought pressure.
Price has consolidated near the upper Bollinger Band at $1,092.98 after peaking intraday at $1,076.56. Pivot support is significant at $1,055.95, marking a key level to monitor for intraday pullbacks.
Micron Stock 15-Minute Timeframe: Healthy Consolidation Near Highs
On the 15-minute chart, MU shows consolidation following a pullback from $1,076.56 to close near $1,064.08. With the RSI down to 62.71, the short-term momentum has eased from its more overbought hourly reading.
The 15-minute MACD histogram is positive at 1.25, implying a mild bullish bias in immediate price action. Price tests just below the upper Bollinger Band at $1,067.11, while the mid-band near $1,048.48 offers nearby support should selling increase.
The reduced 15-minute ATR of $8.58 indicates narrower intraday swings, consistent with the current digesting phase after the recent sharp gains, as the stock trades in a tight range rather than extending its trend.
Bullish Outlook for Micron Stock
The bullish thesis for Micron revolves around accelerating AI-driven demand for high-bandwidth memory, a key strength for MU. Analyst upgrades are substantial, with Susquehanna raising the price target to $1,750, implying about 70% upside.
Technically, a sustained daily close above the $1,076–$1,088 zone, aligning with intraday highs and resistance levels, would endorse ongoing momentum. Holding above the daily pivot at $1,052 and continued positive MACD readings support this case. Dips to the $1,028–$1,050 range attracting buying interest would signal healthy trend continuation setups.
Bearish Considerations Amid Overbought Conditions
Despite strong fundamentals, the technically overextended position suggests increased downside risk. The daily RSI above 80 and price trading beyond the daily Bollinger upper band imply vulnerability to pullbacks.
Failure to maintain the daily pivot at $1,052.63 would raise caution, while a break below support at $1,028.74 could challenge the bullish structure. Market or sector-specific negative news could prompt swift corrections of $60–$100, easily achieved given the daily ATR.
Investment caution is echoed in external analyses warning that chasing MU at these levels may not suit all investors, reflecting the cyclicality and volatility characteristic of the memory sector.
Positioning and Outlook Summary for Micron Stock
Overall, the bias for Micron stock remains bullish on the daily timeframe with fundamental drivers underpinning technical strength. However, numerous overbought signals require disciplined trade management. Entry above current prices near $1,064 offers a challenging risk-reward profile.
Pullbacks toward $1,028–$1,050 provide more balanced entry opportunities, with the daily pivot zone acting as key support. Unless a daily MACD bearish cross occurs or the pivot support is decisively broken, the trend’s path of least resistance points higher, albeit with a reduced margin for error.