

ServiceNow (NOW) closed June 2 at $127.65, absorbing a brutal -6.04% single-session drop even as broader markets moved higher. That divergence is hard to ignore. The daily chart still tells a structurally bullish story over the medium term, but price is now wrestling with a critical overhead ceiling — and the intraday momentum is beginning to crack. The near-term setup is complicated, and traders should treat it accordingly.
Summary
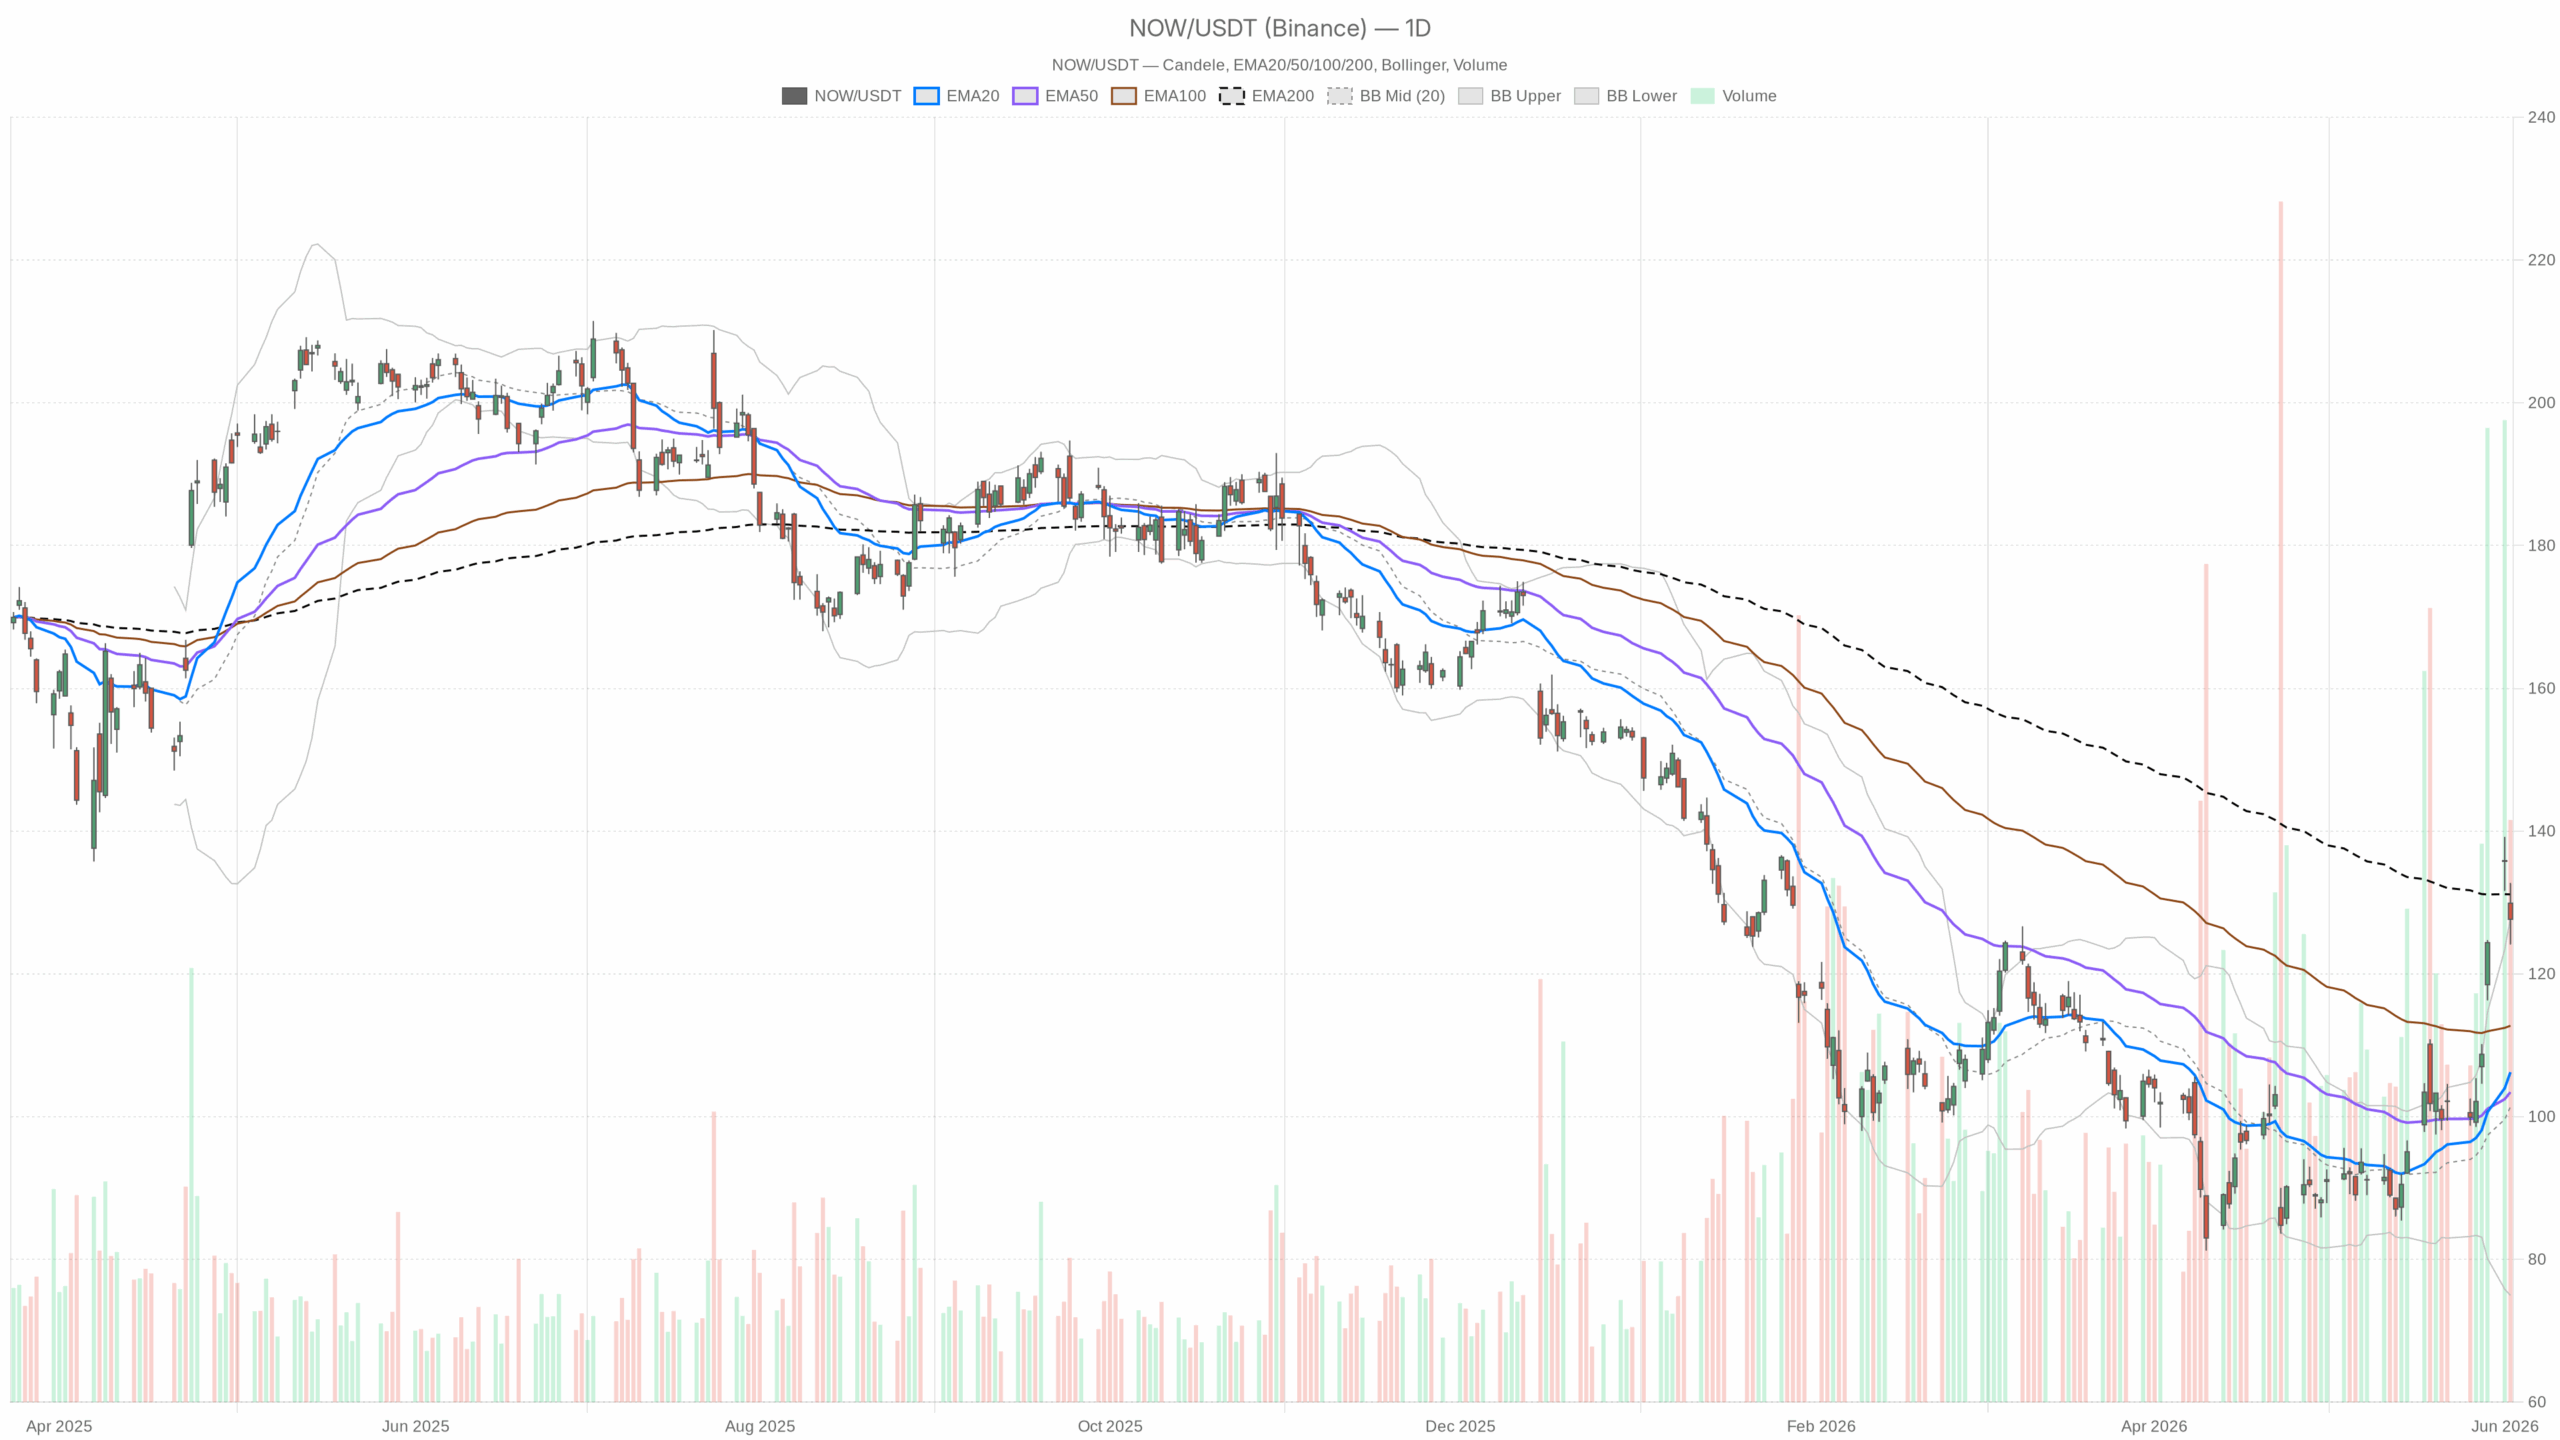
Now Stock Technical Outlook on the Daily Timeframe
On the daily timeframe, the primary trend remains constructive. The EMA20 sits at $106.23 and the EMA50 at $103.44, both well below current price — a clear sign that the multi-week advance has been sustained and meaningful. However, the EMA200 at $131.13 looms directly above Monday’s high of $132.74. Price touched that long-term moving average and immediately reversed. This rejection is significant since the EMA200 is closely watched by institutional participants.
Daily RSI at 68.82 adds another layer of caution. The reading is elevated, not quite overbought but close enough to limit further upside without a consolidation. Meanwhile, the daily MACD tells a more optimistic story with a reading of 7.36 versus a signal of 3.30, and a histogram of +4.06. This tension between a near-overbought RSI and a still-expanding MACD indicates potential for volatile, choppy price action instead of clean directional moves.
The Bollinger Bands on the daily frame reinforce this ambiguity. The upper band at $127.84 is almost exactly where price closed on June 2. Trading at the upper band after a sharp intraday decline suggests selling pressure forced prices down from an overextended position. The mid-band at $101.40 marks the longer-term mean, while the wide band spread (lower at $74.96) reflects an elevated daily ATR of $8.06. Daily swings of $8 or more are currently normal for NOW, emphasizing risk sizing importance.
Daily pivot analysis places the pivot point at $128.17, resistance R1 at $132.22, and support S1 at $123.60. The June 2 close of $127.65 landed just below the pivot — a mild negative signal for the next session’s bias. Recovery above $128.17 would neutralize short-term bearish pressure, while a break below S1 at $123.60 opens the door to more meaningful corrective moves.
Hourly Chart Reveals Mixed Momentum Signals for Now Stock
On the hourly chart, the regime is flagged as bullish, providing some relief. The H1 EMA stack is properly aligned: EMA20 at $125.87, EMA50 at $117.35, EMA200 at $103.34—all below price and ascending. This structure confirms the broader uptrend remains intact beneath the surface. However, the hourly MACD is flashing a warning: the line at 3.86 has crossed below the signal at 5.28, creating a histogram of -1.42. This negative crossover reflects the day’s sharp selloff, weakening but not invalidating the bullish hourly regime.
Hourly RSI at 58.15 shows neutral-to-constructive momentum, leaving room for price to move either way without constraint. The hourly Bollinger mid-band at $128.79 sits just above current price, acting as immediate resistance. An hourly ATR of $3.56 confirms realistic swings of $3–4 per hour during active sessions. The hourly pivot support at $126.96 and resistance at $128.38 establish a tight range likely defining the next few hours of price action.
Short-Term Stability Signs on 15-Minute Chart
The 15-minute chart regime is neutral. RSI at 49.63 is flat, positioned midrange. The 15m MACD line at -0.59 is crossing back above the signal at -0.99, with the histogram turning positive at +0.41. This micro-crossover hints at minor stabilization after the session’s decline. Price at $127.64 sits marginally above the 15m EMA20 at $127.36 and EMA50 at $127.53, suggesting temporary footing.
The 15m Bollinger upper band at $127.97 aligns with the 15m pivot resistance R1 at $128.07—a compressed resistance zone likely to cap any initial bounce attempts.
Fundamental Backdrop Influences Now Stock’s Technical Setup
Fundamentally, the backdrop is mixed. ServiceNow’s expanding AI partnerships with AWS, Nvidia, Experian, and others remain credible long-term growth drivers. The enterprise workflow automation story is intact. Conversely, a Seeking Alpha analysis recently assigned a Sell rating, citing weakening renewal and retention metrics, compressing gross margins due to cloud and AI cost pressures, and buyback dilution from stock-based compensation.
Additionally, shareholders rejected a governance proposal at the May annual meeting. These factors introduce friction to an already technically stretched setup. The -6.04% single-session drop, while broader markets improved, signals active distribution by some participants near current levels.
Bullish Scenario: Key Levels to Watch in Now Stock
The bullish scenario hinges on reclaiming the daily pivot at $128.17 and holding above the $124–$125 zone during any further weakness. Stabilization above this range would suggest the EMA200 test was a healthy consolidation rather than a distribution top.
A subsequent break above $132.22—the daily R1 and EMA200—would restore full bullish momentum and attract trend-following buyers. The AI partnership growth narrative provides a credible fundamental catalyst if execution remains strong.
Bearish Scenario: Potential Downside Risks for Now Stock
The bearish case gains traction if the daily S1 support at $123.60 fails on a closing basis. Below that level, the next logical support zone is $115–$117, where the hourly EMA50 and prior consolidation converge.
Further deterioration in renewal metrics or increased macro pressure from geopolitical tensions, noted in recent news, could accelerate downside moves. The daily regime is neutral, reflecting uncertainty from the EMA200 rejection and elevated RSI despite strong EMA alignment.
Conclusion: Now Stock at a Critical Technical Inflection Point
Overall, NOW stock faces a genuine inflection point. The structural trend remains bullish, but it has encountered its most significant technical resistance and sold off sharply on a day when broad markets moved higher. Elevated volatility, reflected by a daily ATR of $8, demands respect. Conflicting signals across timeframes call for patience rather than conviction.
This moment is not for chasing positions. Instead, traders should observe price behavior closely around the $127–$128.17 pivot zone during the next one to two sessions before committing to a directional view.