

Planet Labs stock is caught in a genuine tug-of-war between strong fundamentals and cautious technical signals. Despite record revenue and a bullish outlook, price action reveals fading momentum and margin pressures that limit near-term upside.
Summary
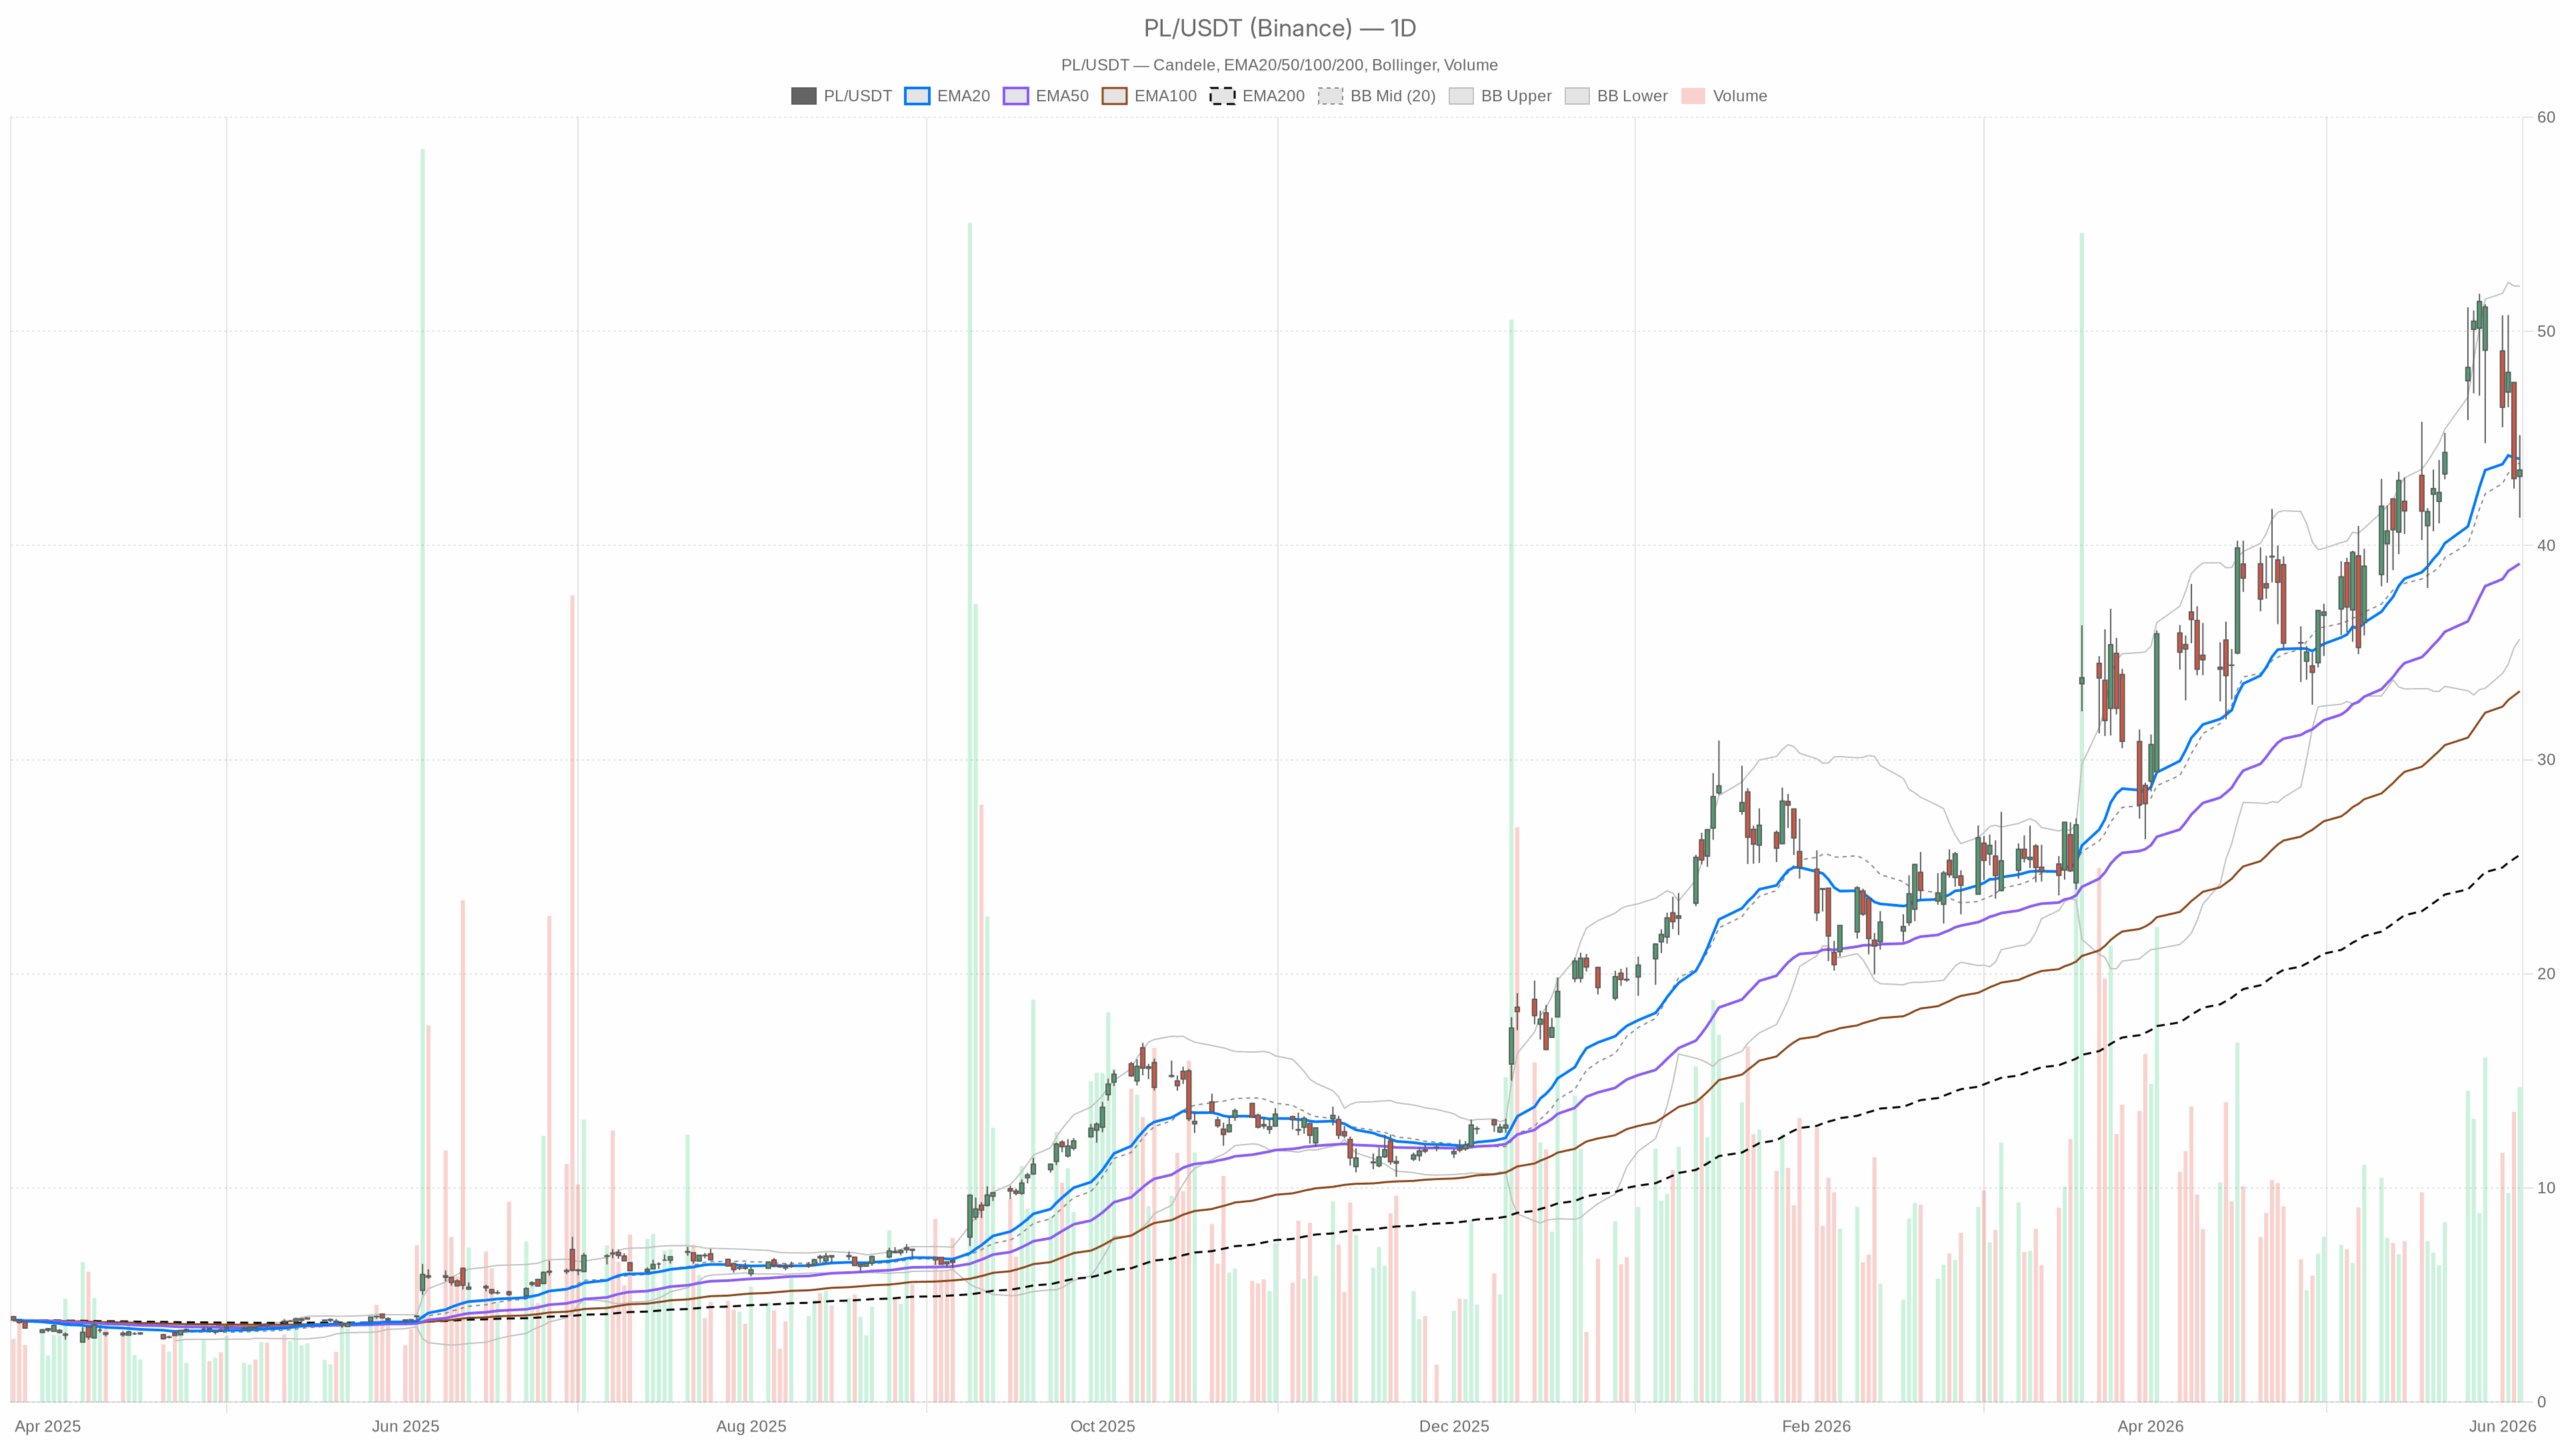
Planet Labs Stock Price Volatility and Daily Technical Setup
On the daily timeframe, PL closed at $43.53 on June 4, ranging broadly between $41.30 and $45.16. This wide intraday band, combined with a daily Average True Range (ATR) of $4.41, highlights elevated volatility and indecision around these levels. The daily technical regime is neutral, supported by indicator analysis.
The daily EMA structure shows price sitting just below the EMA20 at $44.05. Meanwhile, the EMA50 is at $39.16 and the EMA200 at $25.55, both significantly below current price. This gap reflects the strong rally over a longer horizon. However, PL’s failure to sustain above the EMA20 intraday signals short-term momentum is softening. Structurally, the trend remains intact but weakening at the leading edge.
Momentum Indicators Signal Consolidation
The daily RSI stands flat near 51.53, indicating no directional momentum pressure. The MACD histogram turned slightly negative at -0.40, with the MACD line at 2.47 crossing below its signal at 2.87, signaling a subtle peak in bullish momentum. Bollinger Bands position PL near the midpoint at $43.87, revealing ample room for movement without immediate structural extremes.
Key Support and Resistance Levels on Daily Chart
Daily pivot points identify support at $41.50, a pivot at $43.33, and resistance at $45.36. The close slightly above the pivot is technically positive but not decisively so. Holding above $43.33 would maintain a neutral to mildly bullish bias.
Hourly and Shorter Timeframe Technical Weakness in Planet Labs Stock
The hourly chart adds complexity. PL closed at $43.52, trading below EMA20 ($45.18) and EMA50 ($46.07). The EMA200 on this timeframe is above price at $42.74, creating a bearish EMA stack that warns of near-term weakness. The hourly RSI at 39.83 approaches oversold territory, indicating sellers control this session. The hourly MACD remains negative at -1.00, though its histogram at +0.03 hints at a slight slowing of selling pressure—yet no reversal signal.
On the 15-minute chart, conditions worsen with price below all major EMAs and the RSI at 37.67. The MACD histogram is marginally negative at -0.06, confirming short-term distribution following a post-earnings fade.
Fundamental Drivers Behind Planet Labs Stock Price Tension
Fundamentally, Planet Labs topped revenue expectations with $94 million for Q1 FY2027, a 42% year-over-year increase and a new record. Its FY2027 revenue outlook now stands at $425–$441 million, supported by a $906 million contract backlog driven by defense demand. Management is targeting the Rule of 40, balancing growth with profitability, while introducing an AI beta to catalyze future growth.
Despite these positives, margin pressure weighs on the stock. Gross margin declined to 56% and may drop further next quarter. EPS surprised negatively by -12.36%, dampening enthusiasm despite revenue beats. This mix explains overnight selling pressure, with PL losing nearly 4% in after-hours trading and the intraday session reflecting cautious market sentiment.
Technical Scenarios for Planet Labs Stock
Bullish Scenario: Holding EMA20 and Breakout
A bullish case requires PL to reclaim and sustain above the daily EMA20 at $44.05. Surpassing daily resistance at $45.36 would signal renewed momentum and market digestion of margin concerns. The intact long-term trend, bolstered by EMA50 and EMA200 far below, supports potential upside if defense contract growth and AI integration accelerate.
Bearish Scenario: Failure to Hold Support and Deeper Retracement
Conversely, failure to hold EMA20 and a fall below daily support at $41.50 would open a path down to the $38–$39 area near EMA50. This scenario, combined with worsening margins, a negative daily MACD crossover, and persistent short-term bearish pressure, could trigger sharper declines. The $4.41 ATR suggests such swings may unfold rapidly.
Overall Market Assessment of Planet Labs Stock
Planet Labs stock embodies a growth story tempered by near-term realities. Its long-term structural trend remains robust among small-cap tech names, but the recent post-earnings environment penalizes bulls. Elevated volatility, conflicting signals across timeframes, and margin uncertainty require caution in position sizing.
The daily chart’s neutral bias with a mild downward tilt and the hourly’s bearish tendencies highlight that without buyer conviction near $42–$43, support tests may arrive sooner than expected. This technical tension mirrors the fundamental push and pull shaping PL’s path forward.