

As of June 15, 2026, Bitcoin trades around $65,654, and the Bitcoin price today reveals two conflicting market stories. A reported US-Iran Strait of Hormuz deal sparked a risk-on bounce, but the structural backdrop remains deeply bearish across higher timeframes.
Summary
Key takeaways
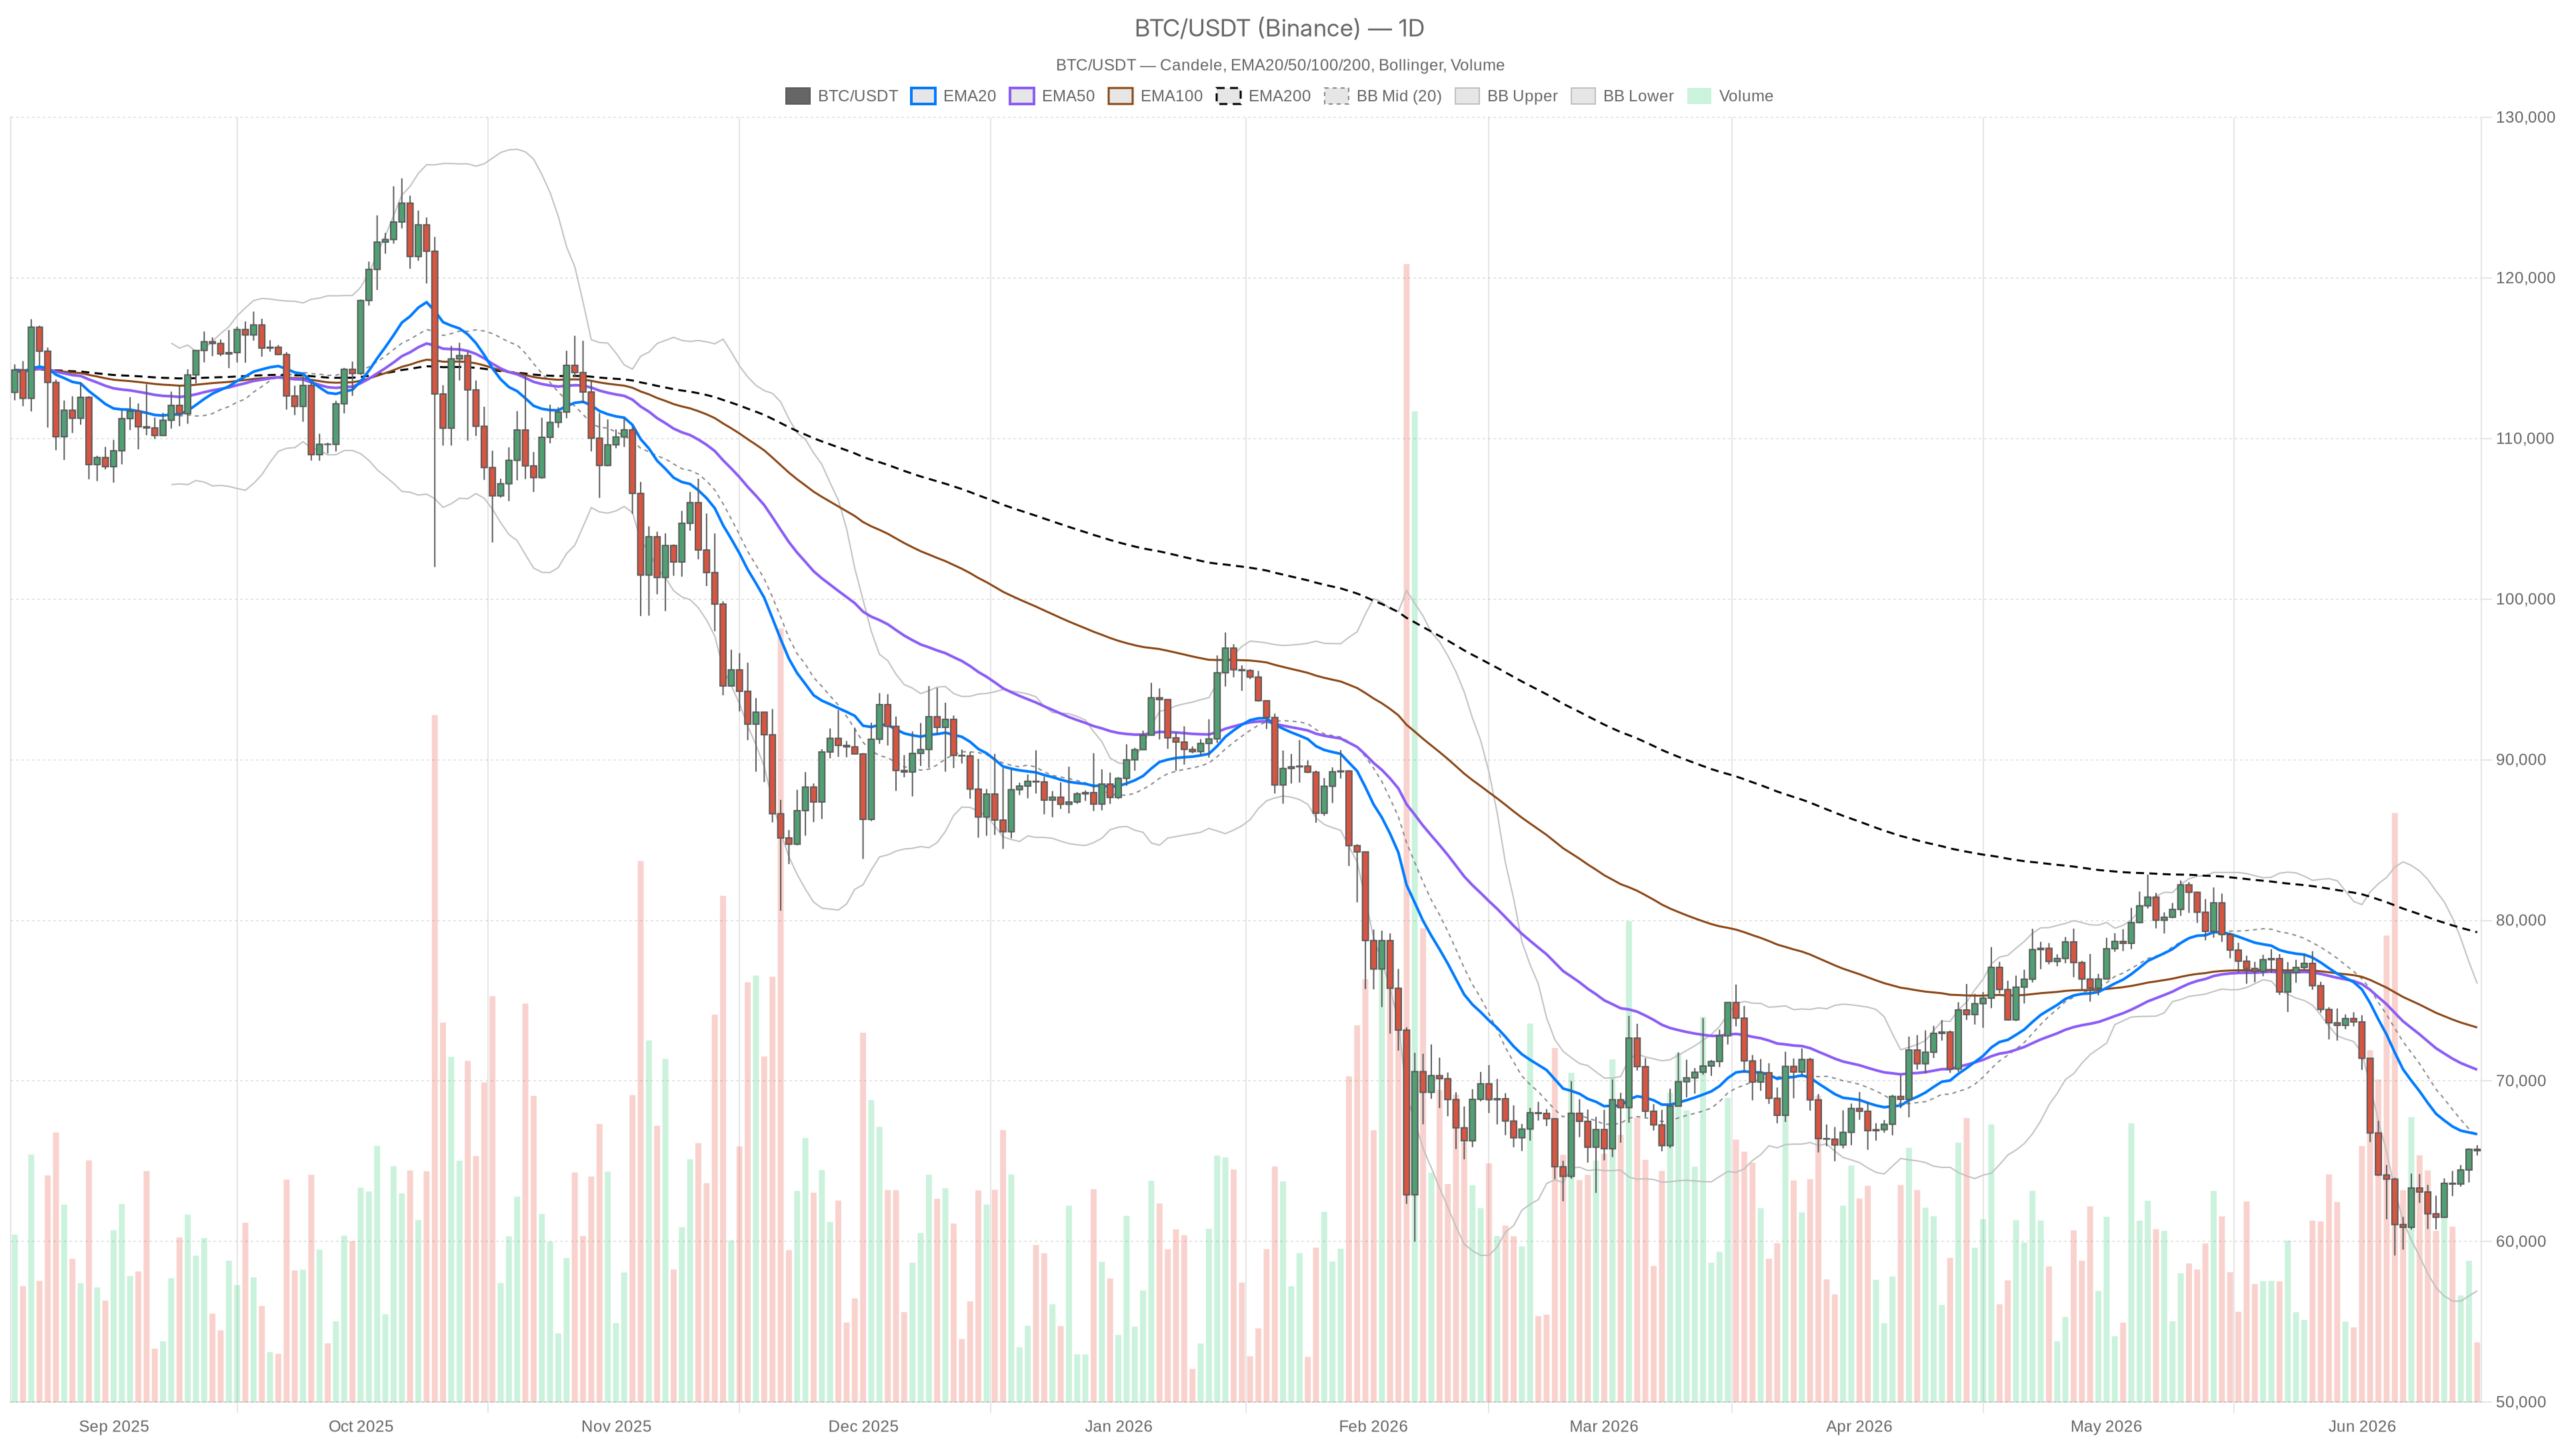
- Bitcoin trades at $65,654 with daily EMAs sloping downward — the 20-day EMA sits at $66,686 and the 50-day at $70,698.
- The Fear & Greed Index is at 20 (Extreme Fear), signaling sidelined participants rather than renewed conviction.
- Hourly momentum shows a genuine bullish structure, but the 15-minute chart already indicates fading steam.
- Daily ATR of $2,651 warns that position sizing is critical in this high-volatility environment.
- A daily close above $66,686 would challenge the bearish thesis; failure could open the door to $56,930.
The Daily Chart Remains in Control — And It’s Bearish
The daily timeframe tells an unambiguous story: Bitcoin is in a bearish regime. Price at $65,654 sits below the 20-day EMA at $66,686 and well below the 50-day EMA at $70,698. The 200-day EMA, currently at $79,259, is so far above current price it underscores just how far Bitcoin has fallen from its structural highs. Consequently, every major moving average slopes downward, and price trades beneath all of them.
The daily RSI at 41.41 reflects subdued momentum — not oversold enough to signal capitulation, not high enough to suggest accumulation. It sits in no-man’s land, where trend traders stay short and mean-reversion buyers hedge. Meanwhile, the MACD remains negative at -2,898 on the line versus -3,369 on the signal, yet the histogram has turned positive at +471. That divergence between still-negative values and an improving histogram offers the first faint signal that selling pressure may be decelerating. It is not a buy signal — it is a warning that bears might need to reassert themselves soon.
Bollinger Bands frame the range well: midline at $66,497, upper band at $76,064, lower band at $56,930. Price hugs the lower half of the range, confirming the broader distribution. The ATR of $2,651 means a single day can move $2,600 or more — anyone trading tight stops in this environment is asking for trouble. The daily pivot sits at $65,669, with R1 at $65,985 and S1 at $65,339. Consequently, Bitcoin is pinned to the pivot, going nowhere decisively.
The One-Hour Bounce Has Real Structure
In contrast, the hourly chart presents a genuinely different picture: the short-term structure is bullish and supported by data. Price at $65,664 trades above the 20-hour EMA ($65,206), the 50-hour EMA ($64,634), and even the 200-hour EMA ($63,775) — a clean EMA stack in the correct order, with price on top. That is textbook short-term bullish structure. The hourly RSI at 63.72 confirms momentum is elevated without being overextended, and the MACD is positive with a histogram still expanding at +53.9. This is a real move, not noise.
However, the hourly Bollinger Bands show price near the upper band at $66,654, with the midline at $64,965 and the lower at $63,276. That upper band will act as resistance. The hourly ATR of $451 is manageable, and the pivot cluster — PP at $65,694, R1 at $65,769, S1 at $65,589 — is tight and directly overhead. Price is fighting through a compressed pivot zone right now.
The 15-Minute Frame Shows Momentum Fading
The 15-minute chart complicates the intraday story. RSI at 49.17 is flat — neither pushing higher nor collapsing. The MACD histogram has turned negative at -42.86 even while the line remains positive, suggesting the short-term push is losing steam. Moreover, price trades below the 15-minute EMA20 at $65,732 and below the Bollinger midline at $65,768. The 15-minute regime is neutral. For anyone looking at entry timing, this is not a clean setup — the momentum spike from the geopolitical news has likely already been priced in.
Timeframe Conflict — And What It Actually Means
In essence, this is the core tension: the daily says the trend is down, the hourly says the short-term move is up, and the 15-minute says that short-term move is already fading. That is a classic bear market bounce configuration. The hourly bullish structure is real — it can extend further, potentially testing $66,500–$66,650, where the upper hourly Bollinger Band and the daily EMA20 sit nearby. But without a catalyst strong enough to push price back above the daily EMA20 at $66,686 on a closing basis, this remains a counter-trend move inside a bearish macro structure. The bears hold the higher-timeframe cards.
The Bull Case
For bulls to take control, Bitcoin needs to close above $66,686 (daily EMA20) and hold it — not just wick through it intraday. If that happens, the next target is the $70,000 area, where the 50-day EMA will likely be waiting. A sustained move above that level would start challenging the bearish regime thesis. The improving daily MACD histogram gives bulls a sliver of hope that momentum is bottoming. The geopolitical relief catalyst has already provided an initial push. That said, invalidation is clear: a daily close back below $64,000 would kill this scenario outright.
The Bear Case
However, the more probable scenario, given the weight of daily evidence, is that this bounce runs into the daily EMA20 wall around $66,500–$66,700, fails to close above it, and rolls over. The Extreme Fear reading of 20 does not support a sustainable sentiment reversal — it reflects an exhausted market that bounces on news but lacks structural buyers. If BTC fails here, the next logical support sits around $56,930 at the lower daily Bollinger Band. The bears’ invalidation is a clean daily close above the 20-day EMA with follow-through volume. Until then, every bounce is a gift for those positioned short.
How to Think About Positioning Right Now
The honest read on the Bitcoin price today is that it sits in a high-volatility, low-conviction environment. The daily ATR alone — nearly $2,700 — demands careful position sizing. Anyone treating the geopolitical bounce as a trend reversal was getting ahead of themselves, and anyone reflexively short into a 63 RSI on the hourly is ignoring real short-term risk. The smarter frame: the daily trend remains down, the hourly has staged a genuine counter-move, and the 15-minute is already showing fatigue. The pivot zone between $65,589 and $65,769 is the battlefield. A clean break above $66,700 would change the calculus, while below $65,000 the bears regain full control.
FAQ
What is Bitcoin trading at today and what caused the bounce?
As of June 15, 2026, Bitcoin is trading around $65,654. The bounce to a two-week high was triggered by a reported US-Iran Strait of Hormuz deal, which sparked a wave of risk-on buying according to Bloomberg.
Is Bitcoin’s current trend bullish or bearish?
The daily timeframe is unambiguously bearish. Bitcoin trades below the 20-day, 50-day, and 200-day EMAs, all of which are sloping downward. The hourly chart shows a short-term bullish structure, but this remains a counter-trend move within a broader downtrend.
What are the key levels to watch for Bitcoin right now?
The critical resistance is the daily 20-day EMA at $66,686 — a close above it would challenge the bearish thesis. On the downside, support sits at $65,000, with the lower daily Bollinger Band at $56,930 representing the next major level if selling resumes.
Disclaimer: This article is for informational purposes only and does not constitute financial advice, an investment recommendation, or a solicitation to buy or sell any financial instrument or cryptocurrency. The analysis provided is not indicative of future results. Investing in crypto assets and financial markets carries a high risk of capital loss. Always do your own research (DYOR) and consult a qualified financial advisor before making any decision.
Article produced with the assistance of artificial intelligence and reviewed by the editorial team.