

As of late June 2026, XRP finds itself in a precarious position, with the Ripple price sitting directly on its daily pivot at $1.05 — a last line of defense in a confirmed bearish regime. The broader crypto market, steeped in Extreme Fear at just 12 out of 100, offers no comfort to altcoin holders.
Summary
Key takeaways
- XRP is trading at $1.05, directly on its daily pivot point, with a fully inverted EMA structure confirming the bearish trend across all major timeframes.
- The daily RSI at 32.51 hovers near oversold territory, while MACD has flatlined — signaling momentum exhaustion rather than an imminent reversal.
- Hourly charts show extreme Bollinger Band compression between $1.04 and $1.05, a coiling pattern that typically precedes a sharp, directional breakout.
- A bullish recovery requires reclaiming $1.08 and then $1.12; bearish continuation targets the $1.01 lower band and the sub-$1.00 zone.
- The Fear & Greed Index sits at 12 out of 100 in Extreme Fear, with Bitcoin dominance near 56%, reflecting sustained capital flight from altcoins.
The Daily Chart Confirms a Bearish Regime
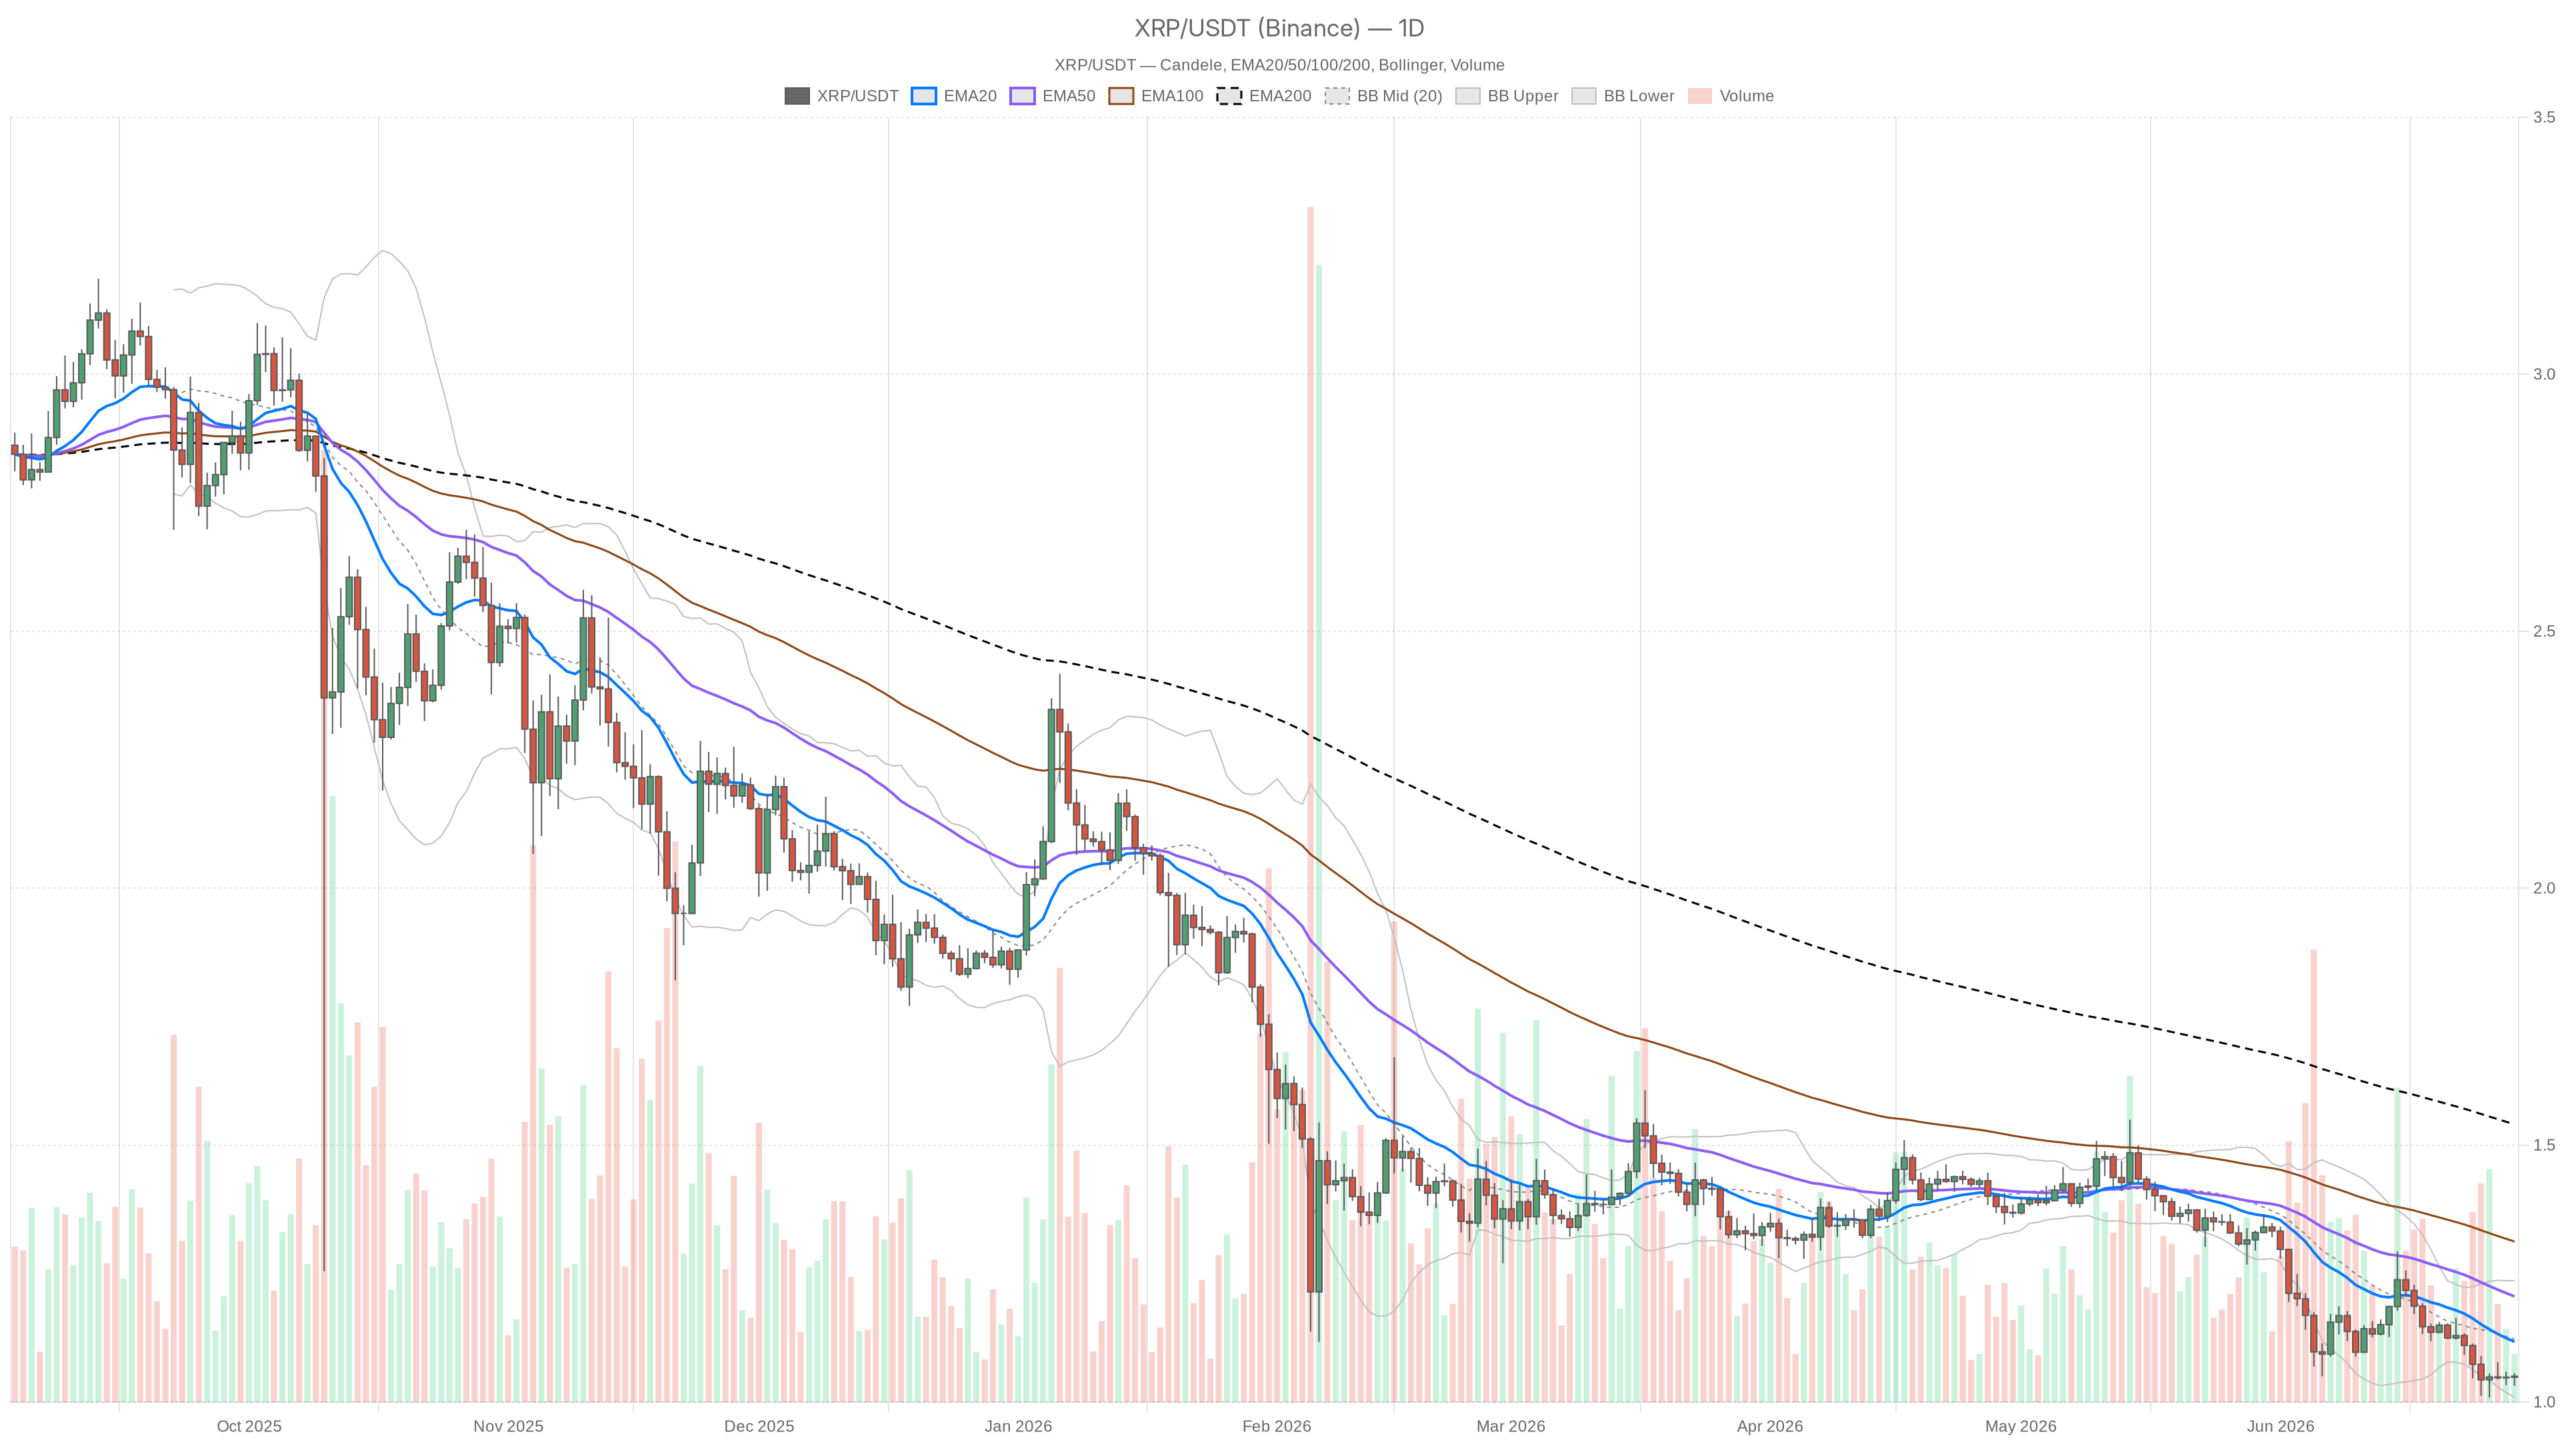
The daily Ripple price structure is unambiguously bearish: XRP at $1.05 trades well below the 20-day EMA at $1.12, the 50-day at $1.21, and dramatically below the 200-day EMA at $1.54. That configuration — every moving average above price, each below the longer one — leaves no room for bullish interpretation.
The daily RSI at 32.51 hovers near oversold territory without breaching it. Historically, XRP has mounted bounces from this zone, but in a broken trend an RSI near 30 more often reflects persistent selling pressure than a reliable reversal trigger. Without a divergence where price prints lower lows while RSI makes higher lows, this reading remains a warning rather than a buy signal.
Meanwhile, the daily MACD tells a story of exhaustion rather than reversal. The line and signal both sit at -0.05, with the histogram flat at zero. After a prolonged decline, a zeroed histogram can signal fading bearish momentum — yet without a positive crossover, it equally suggests a pause before another leg down. This dead cross in stasis warrants caution, not excitement.
Moreover, Bollinger Bands frame the predicament clearly: the lower band rests at $1.01, the midline at $1.12, and the upper band at $1.24. Price at $1.05 hugs the lower half, well below the midline, which coincides precisely with the 20-day EMA. Until XRP reclaims $1.12 on a daily close, the Bollinger structure reinforces the bearish narrative. A daily ATR of $0.04 implies any move higher would require several sessions of sustained buying.
Short-Term Timeframes Show Extreme Compression
The hourly chart reveals a market holding its breath: the 20-EMA, 50-EMA, and price are all pinned at $1.05, while the 200-EMA sits marginally higher at $1.08. Bollinger Bands have compressed to a tight $1.04 to $1.05 range, the MACD reads zero across the board, and the RSI rests at a dead-neutral 52. This is textbook coiling — the kind that typically resolves into a sharp, directional breakout reflecting the dominant higher-timeframe bias.
The 15-minute chart mirrors this picture almost exactly, with all EMAs stacked at $1.05 and ATR near zero. For traders, this means there is very little meaningful intraday structure to trade against. Entering a position here amounts to choosing a side before the compression resolves — a bet on direction rather than a trade with clean technical confirmation.
What a Bullish Recovery Would Require
For XRP to mount a credible recovery, holding $1.05 is not enough. The first meaningful hurdle is a decisive hourly close above $1.08, reclaiming the hourly 200-EMA. Beyond that, $1.12 — the daily 20-EMA and Bollinger midline — serves as the real checkpoint. A sustained close above that level would suggest the bearish trend is at minimum pausing for a retracement toward $1.21, the daily 50-EMA.
However, invalidating the bearish view entirely would require more: a strong multi-day reclaim of $1.21 with volume expansion, a daily RSI breakout above 50, and a MACD histogram turning positive. These conditions do not exist today, but they are worth monitoring — especially if broader market sentiment shifts away from Extreme Fear.
The Bearish Scenario — Limited Support Below
On the downside, the immediate reference is the daily lower Bollinger Band at $1.01. Below that level, no strong technical floor is visible in the current data set until price enters the sub-$1.00 psychological zone, which carries its own reflexive significance. A daily close below $1.04 — the daily S1 pivot — would signal that even the short-term equilibrium at $1.05 has failed.
The bearish case itself gets invalidated only if the $1.01 support holds firmly on a retest and price reverses higher with conviction. A failed breakdown followed by a strong reclaim of $1.05, accompanied by a positive MACD histogram on the hourly chart, would be the first honest signal that a low is potentially forming.
How to Position in This Environment
For now, XRP offers no high-conviction setup in either direction. The daily trend is broken, sentiment sits at extremes, and the short-term coiling pattern remains unresolved. This combination rewards patience — waiting for a clear breakout before committing capital — rather than aggressive positioning ahead of the move.
Meanwhile, traders leaning bullish should wait for $1.08 to clear on the hourly chart before considering early entries, using $1.01 as the hard stop. Those looking for continuation lower should respect the oversold daily RSI as a friction point. Chasing shorts into deeply compressed, low-ATR conditions often means accepting outsized risk for limited reward.
The compression will break — that much is certain. When it does, the daily trend gives bears the structural edge, but the market has not moved yet. Forcing a trade before the resolution arrives is the fastest way to get caught on the wrong side of a sharp squeeze. Volatility is low right now, yet low volatility in Extreme Fear is not calm — it is a coiled spring. Position sizing should reflect that reality.
FAQ
Is XRP in a bearish or bullish trend right now?
XRP is in a confirmed bearish trend. The daily chart shows a fully inverted EMA structure, with price trading below the 20-day, 50-day, and 200-day EMAs. The daily RSI at 32.51 and flat MACD confirm persistent selling pressure with no reversal signal yet.
What price levels matter most for XRP right now?
The key levels are $1.08 (hourly 200-EMA), $1.12 (daily 20-EMA and Bollinger midline), and $1.21 (daily 50-EMA) on the upside. On the downside, $1.04 (daily S1 pivot), $1.01 (daily lower Bollinger Band), and the sub-$1.00 psychological zone are the critical references.
Should traders buy XRP at $1.05?
Aggressive buying at $1.05 is not supported by the current technical structure. The coiling pattern on short-term timeframes has not yet resolved, and the daily trend remains bearish. Traders are better served waiting for a confirmed breakout above $1.08 on the hourly chart before considering long positions.
What does the Extreme Fear reading mean for XRP?
The Fear & Greed Index at 12 out of 100 reflects intense risk aversion across crypto markets, with capital flowing toward Bitcoin — dominance near 56% — rather than altcoins like XRP. While Extreme Fear can precede market bottoms, it does not guarantee one when the asset’s own technical structure remains broken.
Disclaimer: This article is for informational purposes only and does not constitute financial advice, an investment recommendation, or a solicitation to buy or sell any financial instrument or cryptocurrency. The analysis provided is not indicative of future results. Investing in crypto assets and financial markets carries a high risk of capital loss. Always do your own research (DYOR) and consult a qualified financial advisor before making any decision.
Article produced with the assistance of artificial intelligence and reviewed by the editorial team.