



As of July 22, 2026, the broader cryptocurrency market reflects hesitancy, with the Fear & Greed Index sitting at 33. Gram (prev. Toncoin) crypto trades at $1.51 USDT, a level that appears quiet on the surface but conceals persistent bearish pressure on the daily chart.
Summary
Key takeaways
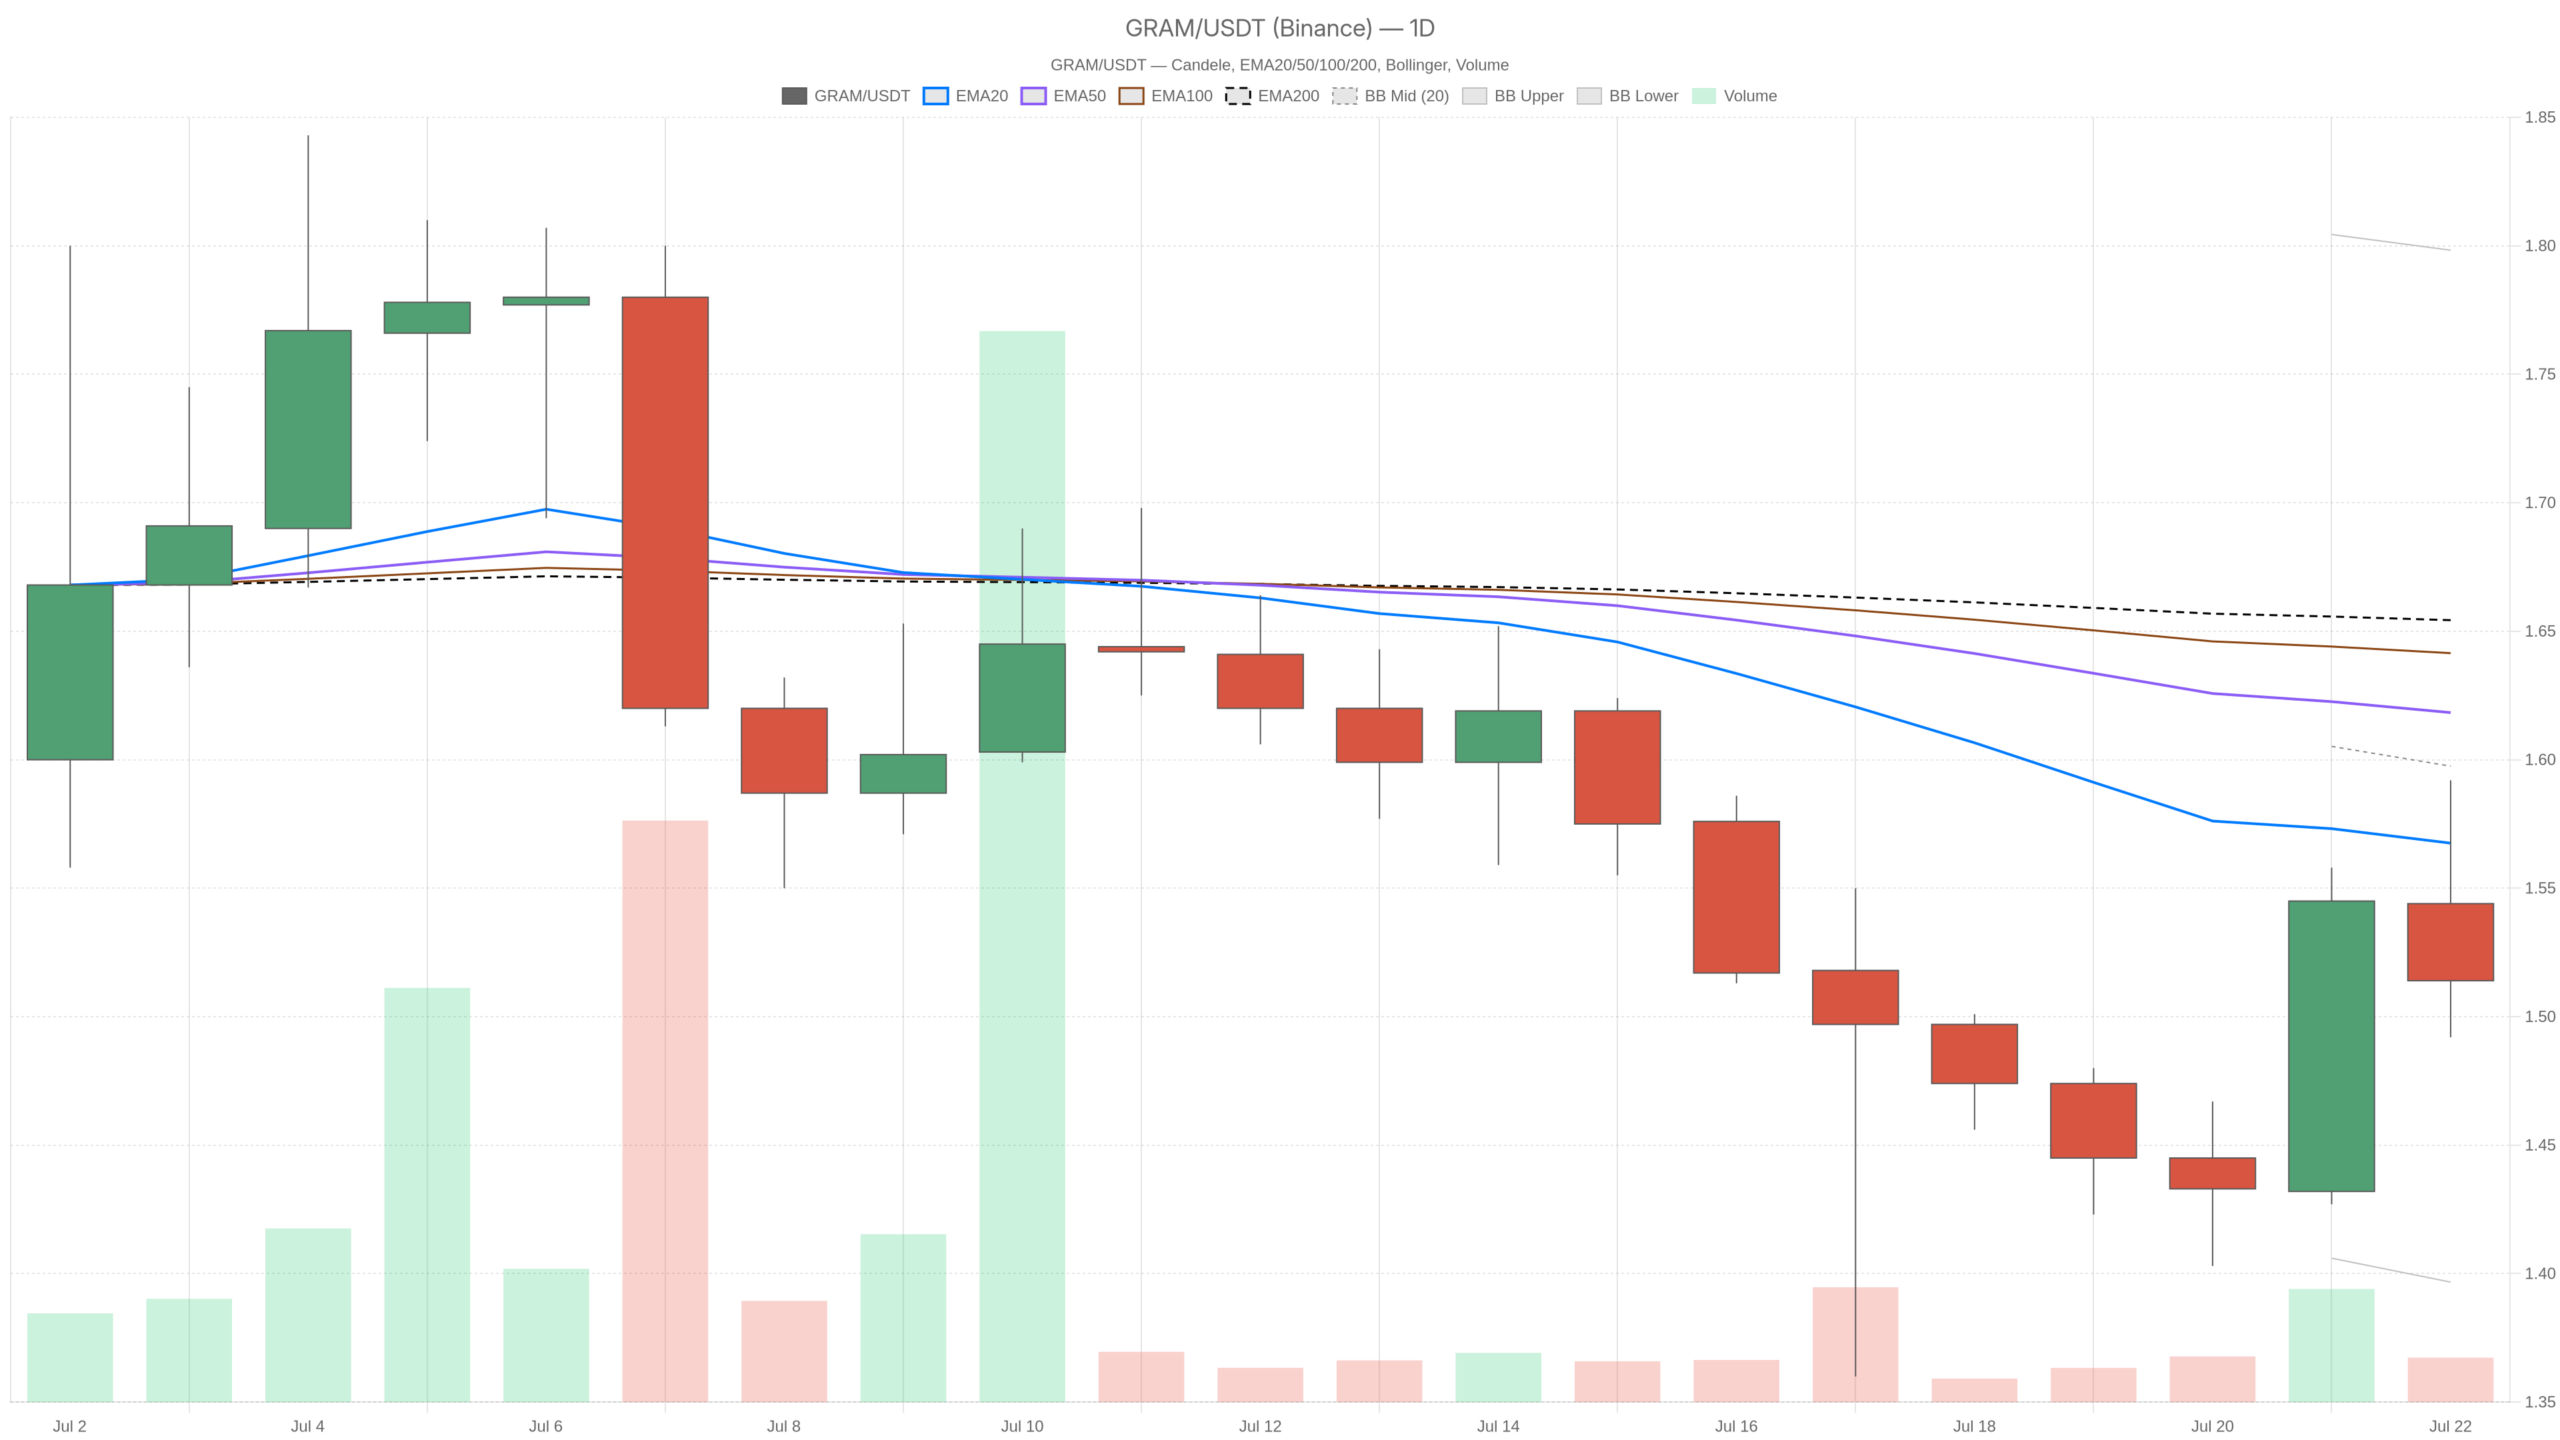
- GRAM is trading at $1.51, below all major daily EMAs — the EMA20 at $1.57, EMA50 at $1.62, and EMA200 at $1.65.
- The daily RSI at 39.28 confirms weak buying pressure without reaching oversold territory, offering no automatic bounce trigger.
- A daily close above $1.57 is required to challenge the bearish structure; failure to hold $1.47 opens the path toward $1.40.
- The broader market remains under pressure, with total crypto market capitalization at $2.32 trillion, down over 1.3% in the past 24 hours.
- Bitcoin dominance above 56.6% signals capital is favoring safety over rotation into mid-cap assets like GRAM.
Daily Chart Breakdown: Bearish Alignment Confirmed
The daily chart presents a firmly bearish structure, with GRAM trading below every meaningful moving average. The EMA20 sits at $1.57, the EMA50 at $1.62, and the EMA200 at $1.65. This is a perfectly stacked bearish alignment where each layer of dynamic resistance sits further overhead. This is not consolidation near support; this is a market that has been consistently rejected and is now drifting below its own structural anchors.
The daily RSI at 39.28 confirms the absence of real buying pressure. However, it has not broken into oversold territory below 30, meaning there is no automatic technical bounce trigger nearby. Moreover, the MACD compounds the picture: the line sits at -0.05, the signal at -0.04, and the histogram at -0.01. The line remains below the signal, the histogram is negative, and there is no visible curl upward. Momentum is bearish, and it has not shown any sign of rolling over into a reversal sequence.
Bollinger Bands on the daily frame reinforce the bearish outlook. The midline rests at $1.60, the upper band at $1.80, and the lower band at $1.40. Price at $1.51 sits in the lower half of the channel — well below the midline, which itself acts as dynamic resistance. A reclaim of $1.60 would mark a meaningful structural shift. Without it, the path of least resistance remains downward. The daily ATR of $0.09 underscores the scale: each candle averages a $0.09 range, significant relative to price.
Pivot Levels and Critical Resistance Zones
The daily pivot sits at $1.53. GRAM’s failure to hold above it on a closing basis confirms seller dominance in the session structure. The R1 resistance level at $1.57 converges almost exactly with the EMA20. This creates a double-layered resistance zone that bulls would need to crack convincingly before any bullish narrative becomes credible. On the downside, $1.47 serves as the first structural floor, and below that the Bollinger lower band at $1.40 becomes the next reference point.
Hourly Chart: Coiling Before the Next Move
The hourly chart shows neutral consolidation rather than a trend reversal, with compressed EMAs signaling an impending directional move. The hourly RSI at 51.46 sits right at the midpoint, neither overbought nor oversold. Furthermore, the MACD on this timeframe is essentially flat: the line at 0.01, signal at 0.01, and histogram at -0.01. This is a market catching its breath, not one reversing direction.
Price is threading between the EMA20 at $1.52, EMA50 at $1.50, and EMA200 at $1.51 — all compressed into a tight band. When three EMAs converge like this, a directional move is typically building. The hourly Bollinger Bands are narrow: upper at $1.57, lower at $1.49, and midline at $1.53. That said, the 15-minute chart mirrors this paralysis, with RSI at 49.91, MACD histogram at zero, and Bollinger Bands compressed between $1.50 and $1.52. Execution-wise, traders would do well to wait for a directional break rather than anticipate one.
Bullish Scenario: The Path to Recovery
A bullish reversal in Gram (prev. Toncoin) crypto requires a clean daily close above $1.57, cracking both R1 and the EMA20 simultaneously. If the hourly RSI pushes above 60 and the MACD histogram turns visibly positive alongside that move, the case for a run toward $1.62 becomes real. That level marks the EMA50. Subsequently, a reclaim of $1.62 would open the door toward the $1.65 EMA200 zone, where the longer-term bear trend genuinely begins to be challenged. This scenario is invalidated if price fails to hold above $1.53 on a daily closing basis, or if any bounce into $1.57 gets sold aggressively.
Bearish Scenario: The Default Outlook
Given the current setup, the bearish scenario remains the default. A daily close below $1.47 — the S1 pivot support — would open the way toward the $1.40 lower Bollinger Band. Below that level, no clear structural floor exists in the current data, meaning drawdown risk must be sized carefully. The bearish thesis is invalidated only by a sustained recovery above $1.57, which would signal that selling pressure has genuinely exhausted itself. Until that happens, every rally into resistance should be treated as a potential distribution opportunity rather than a trend reversal.
Positioning and Risk Management
The multi-timeframe picture for GRAM is a classic case of macro bearishness with short-term neutrality. The daily defines the bias — and that bias is firmly bearish. Meanwhile, the hourly and 15-minute frames are simply showing that the market is coiling before its next move, not that sentiment has changed. The broad market environment, with the Fear & Greed Index at 33 and total crypto market capitalization declining, creates no external tailwind for GRAM.
DEX fee activity across major protocols like Uniswap V3 and Fluid DEX has also declined sharply over the past week, suggesting reduced on-chain activity broadly. This is not a backdrop that typically sparks sharp altcoin recoveries. Anyone already holding GRAM should assess the structural damage caused by trading below all key daily EMAs. Moreover, anyone considering a position should wait for either the bearish scenario to play out toward $1.47–$1.40 for a potential risk/reward entry, or for the bullish scenario to trigger with a clean break above $1.57. Trading the middle — buying into a range with no clear momentum — is where accounts bleed slowly. Volatility is present, uncertainty is real, and the market is not rewarding guesses right now. This analysis is for informational purposes only and does not constitute financial advice.
FAQ
What is the current price of GRAM?
As of July 22, 2026, GRAM is trading at $1.51 USDT, sitting below its daily pivot of $1.53 and all major exponential moving averages on the daily chart.
What are the key resistance levels for GRAM?
The first major resistance is at $1.57, where R1 converges with the EMA20. Above that, the EMA50 at $1.62 and the EMA200 at $1.65 form the next structural hurdles that bulls must overcome.
Is GRAM’s trend bullish or bearish right now?
The daily trend is firmly bearish. Price trades below all key EMAs, the RSI sits at 39.28, and the MACD remains negative with no visible reversal signal on any timeframe.
What support levels should traders monitor?
S1 support sits at $1.47, and the lower Bollinger Band at $1.40 serves as the next structural floor. No clear support level exists below $1.40 in the current technical data.
Disclaimer: This article is for informational purposes only and does not constitute financial advice, an investment recommendation, or a solicitation to buy or sell any financial instrument or cryptocurrency. The analysis provided is not indicative of future results. Investing in crypto assets and financial markets carries a high risk of capital loss. Always do your own research (DYOR) and consult a qualified financial advisor before making any decision.
Article produced with the assistance of artificial intelligence and reviewed by the editorial team.
