



Lion Group Holding Ltd. stock closed at $1.35 on July 27, 2026, well below its $2.04 open. The daily regime is firmly bearish. Price, momentum, and trend structure all confirm a stock in distribution, with sellers in control.
Summary
Key takeaways
- LGHL closed at $1.35 on July 27, 2026, well below its opening of $2.04.
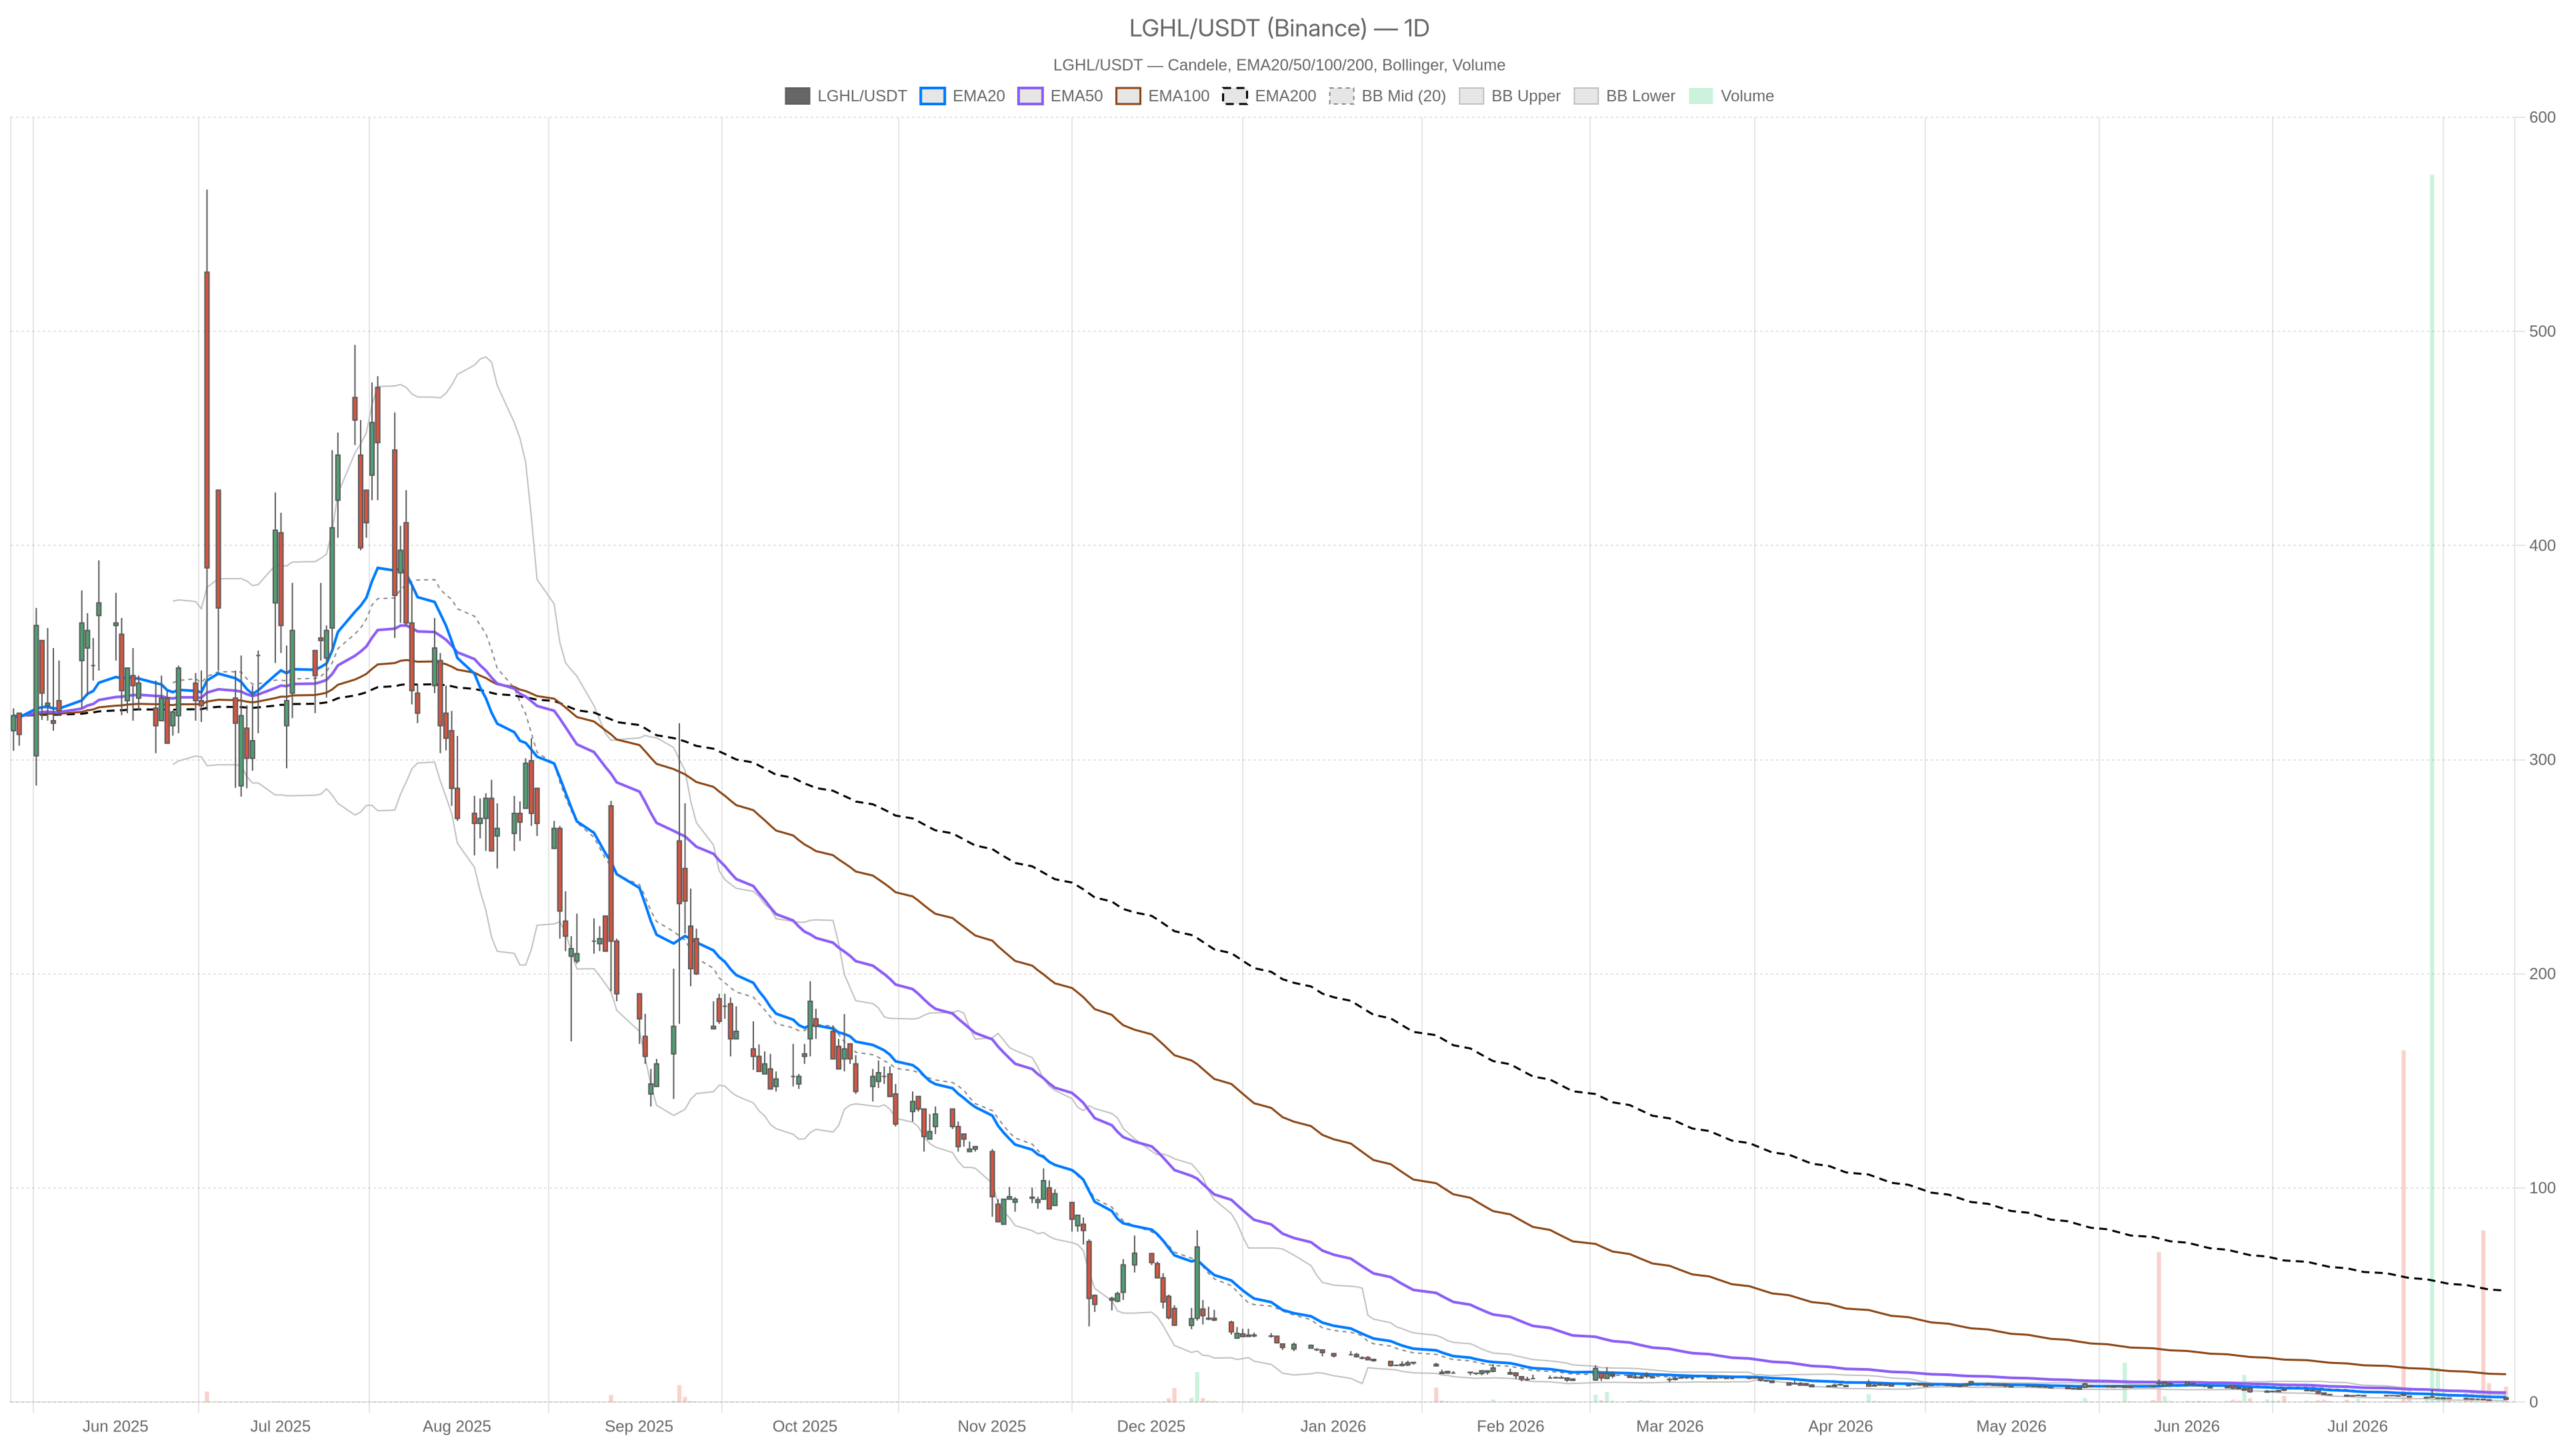
- The daily trend is firmly bearish, with price below EMA20 ($2.34), EMA50 ($4.45), and EMA200 ($52.09).
- Daily RSI at 30.27 hovers near oversold but offers no reversal signal in a bearish regime.
- Hourly and 15-minute MACD histograms are marginally positive, hinting at slowing downside momentum.
- A daily ATR of $0.77 — over 57% of current price — signals extreme volatility and wide daily swings.
Daily Bias: Entrenched Bearish Trend in Lion Group Holding Ltd. Stock
The daily trend for LGHL is unequivocally bearish. Price trades far below all major moving averages, with no dynamic support in sight.
The EMA20 sits at $2.34, the EMA50 at $4.45, and the EMA200 at $52.09. Price at $1.35 is trading far beneath all three. This formation signals not just a downtrend, but a prolonged structural breakdown. Each of these levels now represents overhead resistance on any attempted recovery.
Momentum and Range Structure
Meanwhile, the daily RSI at 30.27 hovers near oversold territory. However, oversold does not equal reversal. In a confirmed bearish regime, RSI can remain compressed near these levels for extended periods while price continues to erode. The reading indicates exhaustion, not yet a credible base.
Meanwhile, the daily MACD tells a similar story. The MACD line reads -1.04 against a signal of -1.07, with a histogram of +0.03. The histogram has ticked marginally positive — a faint sign that downside momentum may be decelerating. On its own, this is insufficient evidence of a trend shift. It is a nuance worth watching, not a thesis to build on.
Bollinger Bands on the daily frame place the midline at $2.21, the upper band at $3.70, and the lower band at $0.73. Price at $1.35 sits well below the midline. The lower band remains a notable floor. A daily ATR of $0.77 reflects elevated volatility relative to price. Daily swings remain wide and unpredictable.
Daily pivot analysis sets the pivot point at $1.58, with R1 at $1.83 and S1 at $1.09. LGHL closed below its daily pivot, reinforcing near-term directional weakness. The $1.09 support level becomes the next meaningful reference if selling pressure resumes.
Hourly Conflict: A Complicating Signal
The 1-hour timeframe shows a neutral regime. This suggests the intense selling has paused intraday — though it has not reversed.
The hourly RSI reads 58.08. That is a meaningful divergence from the daily oversold condition. Price is trading above the hourly EMA20 at $1.15 and EMA50 at $1.45. This short-term positioning above near-term averages points to an intraday bid. However, the hourly EMA200 at $6.78 remains a distant and crushing overhead level. It confirms the longer structural damage.
Similarly, the hourly MACD shows a line of -0.13 against a signal of -0.15, with a histogram of +0.02. Across both timeframes, this is a consistent signal that downward momentum is slowing. It is not reversing, but losing energy.
Hourly Bollinger Bands set the upper band at $1.52 and the lower at $0.80, with a midline at $1.16. Price at $1.37 is trading above the hourly midline. This is another indication of short-term stabilization. The hourly ATR of $0.16 suggests intraday volatility has compressed relative to the daily range. This is consistent with a pause rather than continuation.
15-Minute Context: Short-Term Momentum Firming
The 15-minute chart shows the most constructive momentum across all timeframes. A positive MACD crossover and RSI near overbought signal firming short-term conditions.
The 15m regime is neutral. RSI at 64.49 is approaching overbought on the short-term chart. The 15m MACD shows a line of +0.06 against a signal of -0.01, producing a histogram of +0.07. That is a genuine positive crossover on the micro timeframe.
Meanwhile, price is trading above the 15m EMA20 at $1.08 and EMA50 at $1.11. It sits just below the EMA200 at $1.51. The 15m pivot at $1.40 and R1 at $1.43 are close to recent price levels. In execution terms, this is not a clean breakout. It is a micro-level holding pattern beneath near-term resistance.
Bullish Scenario: What Would Need to Happen
A credible bullish reversal requires LGHL to reclaim the daily pivot at $1.58 with conviction and volume. Without this, any rally remains a short-term countertrend bounce.
First, the stock would need to close above the daily pivot at $1.58 with meaningful volume. That level represents the minimum structural threshold for any short-term recovery narrative.
Beyond that, the hourly EMA50 at $1.45 and the upper hourly Bollinger Band at $1.52 form a compressed resistance zone. A sustained move through that cluster would begin to shift the short-term bias. The marginally positive MACD histogram on both daily and hourly frames provides a thin but real foundation. If momentum continues to build, the R1 daily level at $1.83 becomes the next target.
Bearish Scenario: What Would Invalidate the Recovery Case
The bearish case remains the path of least resistance for LGHL. Failure to hold the $1.33–$1.35 zone exposes further downside toward $1.09 and potentially $0.73.
The daily EMA stack — with EMA20 at $2.34, EMA50 at $4.45, and EMA200 at $52.09 — represents a formidable overhead supply wall. Any rally lacking sustained volume is likely to meet sellers at each of these levels. The oversold daily RSI does not protect against further downside on its own. In a bearish regime, it signals fragility, not a contrarian buy opportunity.
Notably, the daily ATR at $0.77 represents more than 57% of current price. That level of volatility relative to price makes precise risk management critical. Wide swings in either direction should be treated as noise unless confirmed by structural closes.
Positioning, Volatility, and the Weight of Uncertainty
LGHL remains technically compromised across all major timeframes. The broken moving average structure and elevated volatility make clear directional bets difficult.
Overall, Lion Group Holding Ltd. stock is in a technically compromised position. The daily trend is bearish. The moving average structure is broken at every level. The stock sits near multi-period lows. The hourly and 15-minute frames offer a modest counterpoint — showing stabilizing momentum and short-term intraday support.
However, a pause in selling is not the same as a reversal. Until LGHL reclaims the $1.58 pivot on the daily chart with conviction, the bias remains firmly to the downside. Given the elevated ATR and the wide Bollinger range, volatility is a constant companion here. Caution is warranted. Certainty is not on offer.
FAQ
What is the current price of Lion Group Holding Ltd. stock?
As of July 27, 2026, Lion Group Holding Ltd. stock closed at $1.35, well below its opening price of $2.04.
Is LGHL stock in a bearish or bullish trend?
LGHL is in a firmly bearish daily trend. Price trades below all major moving averages — EMA20 at $2.34, EMA50 at $4.45, and EMA200 at $52.09 — confirming a prolonged structural breakdown.
What are the key support levels for LGHL?
Immediate support sits at the $1.33–$1.35 zone. Below that, the daily S1 at $1.09 and the lower Bollinger Band at $0.73 represent the next structural references.
What would signal a bullish reversal for LGHL?
A bullish reversal requires LGHL to close above the daily pivot at $1.58 with meaningful volume. Beyond that, clearing the $1.45–$1.52 resistance cluster would begin to shift the short-term bias.
Disclaimer: This article is for informational purposes only and does not constitute financial advice, an investment recommendation, or a solicitation to buy or sell any financial instrument or cryptocurrency. The analysis provided is not indicative of future results. Investing in crypto assets and financial markets carries a high risk of capital loss. Always do your own research (DYOR) and consult a qualified financial advisor before making any decision.
Article produced with the assistance of artificial intelligence and reviewed by the editorial team.
