




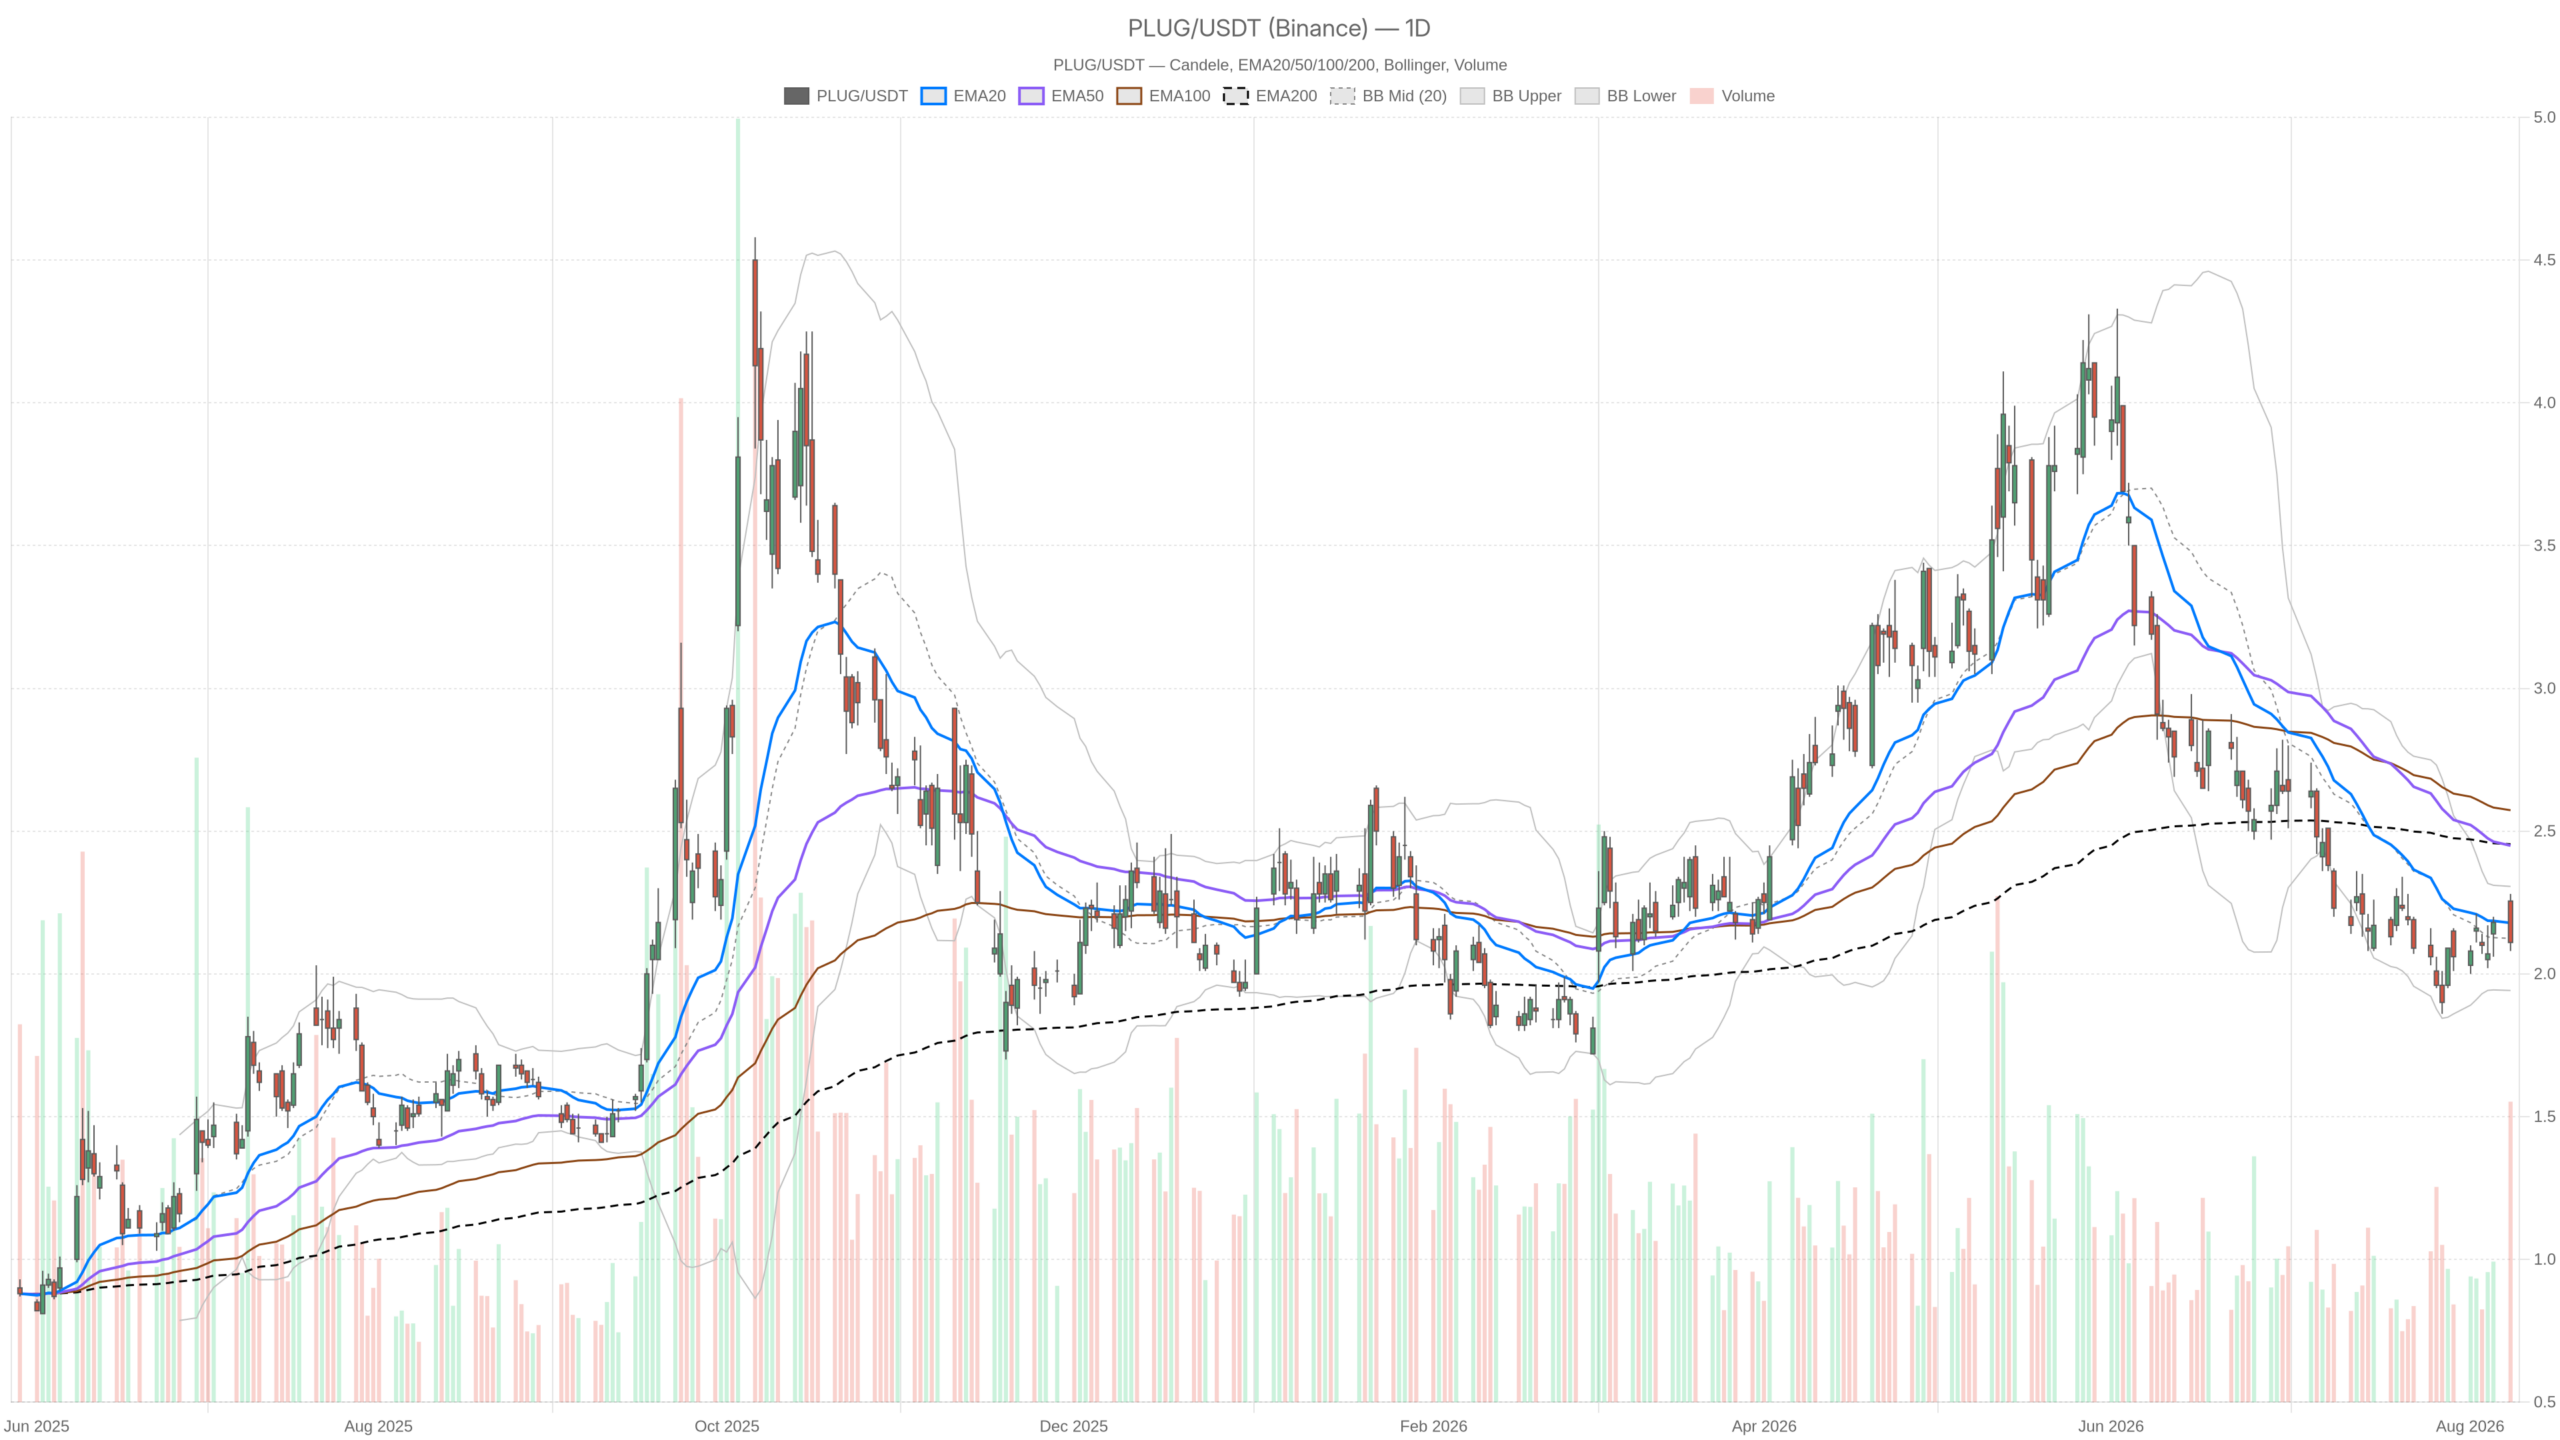
Plug Power stock enters this session with an unresolved conflict. The daily chart still belongs to sellers — price at $2.11 sits below every major moving average. Yet fundamentals just turned friendlier after a Q2 revenue beat and raised guidance. That mismatch is the real story on PLUG.
Summary
Key takeaways
- Plug Power closed at $2.11, below the 20-day EMA ($2.18) and the 50/200-day EMA cluster at $2.45.
- Q2 revenue hit $178.3 million, beating estimates; the GAAP loss of $0.14 per share came in 78.2% below consensus.
- Daily RSI at 42.74 and an improving MACD suggest stabilization, but the trend remains firmly bearish.
- Key levels: $2.16 pivot as resistance, $2.03 as immediate support, and the $1.94 lower Bollinger Band as the next floor.
- Daily ATR of 0.14 signals wide swings on a low-priced stock — position sizing is critical.
Daily structure keeps the bearish bias on Plug Power stock
The daily chart on Plug Power stock remains bearish. Price at $2.11 sits below every major moving average, and the latest candle shows distribution rather than accumulation.
Close at $2.11 sits below the 20-day EMA at $2.18. Price also sits well under the 50- and 200-day EMAs, stacked together at $2.45. That double alignment at the same level matters. This creates a thick supply shelf roughly 16% above spot. The medium-term trend has not repaired itself.
The latest daily candle is also unflattering. Price opened at $2.25, tagged $2.28, then reversed to close at $2.11 near the $2.08 low. Volume was heavy at almost 117 million shares. In practice, that is distribution: buyers showed up early and were absorbed by the close.
Momentum indicators
Momentum, however, is not as one-sided as the trend. Daily RSI at 42.74 is soft but far from oversold, leaving room in either direction. The MACD line at -0.12 remains below zero. Yet it has crossed above its signal at -0.16, producing a positive histogram of 0.04. In other words, the downside impulse is fading even though the trend is still down. That is a classic stabilization signature, not a reversal confirmation.
Volatility and Bollinger Bands
Bollinger Bands frame the range cleanly. The daily mid-band sits at $2.12 — essentially where price closed. The upper band is at $2.31 and the lower at $1.94. Plug Power stock is therefore mean-reverting inside its own volatility envelope rather than trending. Daily ATR of 0.14 is the number to respect. On a $2 stock, that is a wide average daily swing. It makes stop placement genuinely difficult.
Key levels: $2.16 pivot, $2.03 support
The $2.16 daily pivot is the first line of control. Above it, R1 at $2.23 comes into play, then the $2.31 upper band and the heavy $2.45 EMA cluster. Below, S1 at $2.03 is the immediate floor. The $1.94 lower band serves as the next reference. Price closing under the pivot keeps the short-term burden on the bulls.
The 1H chart neutralizes rather than confirms
The hourly chart does not confirm the daily bearish bias. Instead, it shows compression across indicators — a neutral, undecided structure rather than a trending one.
The 1H regime is neutral. The 20-period EMA at $2.11 and the 50-period at $2.10 are effectively flat and intertwined. Price at $2.09 is pinned between them. That is compression, not trend.
Meanwhile the 1H 200-period EMA at $2.24 remains the intraday ceiling that defines the broader downtrend. Hourly RSI at 45.8 is mildly weak but neutral. The MACD is flat on the zero line with a marginally negative histogram of -0.01. Momentum here has simply gone to sleep.
Volatility tells the same story. Hourly ATR is 0.05 against daily bands of $2.02 to $2.20. The 1H pivot structure is razor thin at $2.10, with R1 at $2.12 and S1 at $2.08. Ranges that tight after a high-volume reversal day usually precede expansion. Consequently, the direction of the next break carries more information than the current drift.
15m execution context
The 15-minute chart is mechanically flat and compressed, offering no directional edge for short-term traders. EMAs at $2.11, $2.12, and $2.10 are clustered around price at $2.09. Bollinger Bands are squeezed between $2.08 and $2.13.
ATR is just 0.03 and MACD is effectively zero. RSI at 40.68 is the weakest of the three timeframes, hinting at a mild downside lean into the close of the tape.
For timing purposes, $2.08 to $2.13 is the live micro-range. A clean acceptance above $2.13 opens the path back toward the daily pivot at $2.16. Loss of $2.08 hands control to the $2.03 area.
Bullish scenario
The bullish case for Plug Power stock rests on a Q2 earnings beat plus raised full-year guidance. To gain traction, bulls must reclaim $2.16 and close above the 20-day EMA at $2.18.
Plug Power reported Q2 revenue of $178.3 million, up 2.5% year on year and ahead of estimates. The GAAP loss of $0.14 per share came in 78.2% below consensus expectations. Management raised full-year revenue growth guidance and reiterated the target of positive EBITDA in the fourth quarter. Coverage also pointed to improving margins, lower operating expenses, and reduced cash usage.
Notably, headlines described the stock jumping on those results. The release landed after the price data in hand, so the daily candle does not yet reflect the full reaction. For bulls, the roadmap is straightforward: reclaim $2.16, then close above the 20-day EMA at $2.18 and R1 at $2.23. Above $2.31, the $2.45 EMA wall becomes the real test. A MACD histogram that keeps expanding would strengthen that sequence.
Bearish scenario
The bearish case relies on the visible failure pattern on the daily chart. A fade from $2.28 to $2.11 on heavy volume of nearly 117 million shares signals post-news exhaustion.
If Plug Power stock cannot hold $2.08 on the hourly chart, S1 at $2.03 comes quickly. The $1.94 lower band then becomes the objective. What invalidates the bullish thesis is simple: repeated rejection under $2.16, with price capped by the 1H 200-EMA at $2.24, would confirm that the earnings pop was liquidity for sellers. In that case the improving daily MACD becomes noise inside an intact downtrend.
Overall, the signals are mixed and should be treated as such. The daily trend is bearish, hourly momentum is neutral, and the news flow is constructive. With daily ATR near 0.14 on a low-priced share, position sizing matters more than direction here. Until $2.16 flips into support or $2.03 breaks decisively, the honest read on Plug Power stock is clear. It remains a volatile, headline-driven range with unresolved risk on both sides.
FAQ
What is Plug Power’s current stock price?
Plug Power stock closed at $2.11, sitting below the 20-day EMA at $2.18 and well under the 50- and 200-day EMA cluster at $2.45.
Did Plug Power beat Q2 earnings expectations?
Yes. Q2 revenue reached $178.3 million, up 2.5% year on year and ahead of estimates. The GAAP loss of $0.14 per share came in 78.2% below consensus expectations.
What are the key levels to watch for PLUG?
The $2.16 daily pivot is the first resistance. Above that, $2.23 (R1) and the $2.45 EMA cluster are the next targets. Support sits at $2.03 (S1), with the $1.94 lower Bollinger Band as the next floor.
Is Plug Power stock bearish or bullish right now?
The daily trend remains bearish, but improving momentum and a strong earnings beat introduce a genuine bullish catalyst. The 1H chart is neutral, making this a waiting-for-confirmation market rather than a clear directional call.
Disclaimer: This article is for informational purposes only and does not constitute financial advice, an investment recommendation, or a solicitation to buy or sell any financial instrument or cryptocurrency. The analysis provided is not indicative of future results. Investing in crypto assets and financial markets carries a high risk of capital loss. Always do your own research (DYOR) and consult a qualified financial advisor before making any decision.
Article produced with the assistance of artificial intelligence and reviewed by the editorial team.
