




Nebius Stock enters Q2 earnings technically neutral at $193.23. Long-term structure remains bullish, but sellers control the medium-term trend. With daily ATR near 24, volatility — not direction — defines NBIS ahead of the print.
Summary
Key takeaways
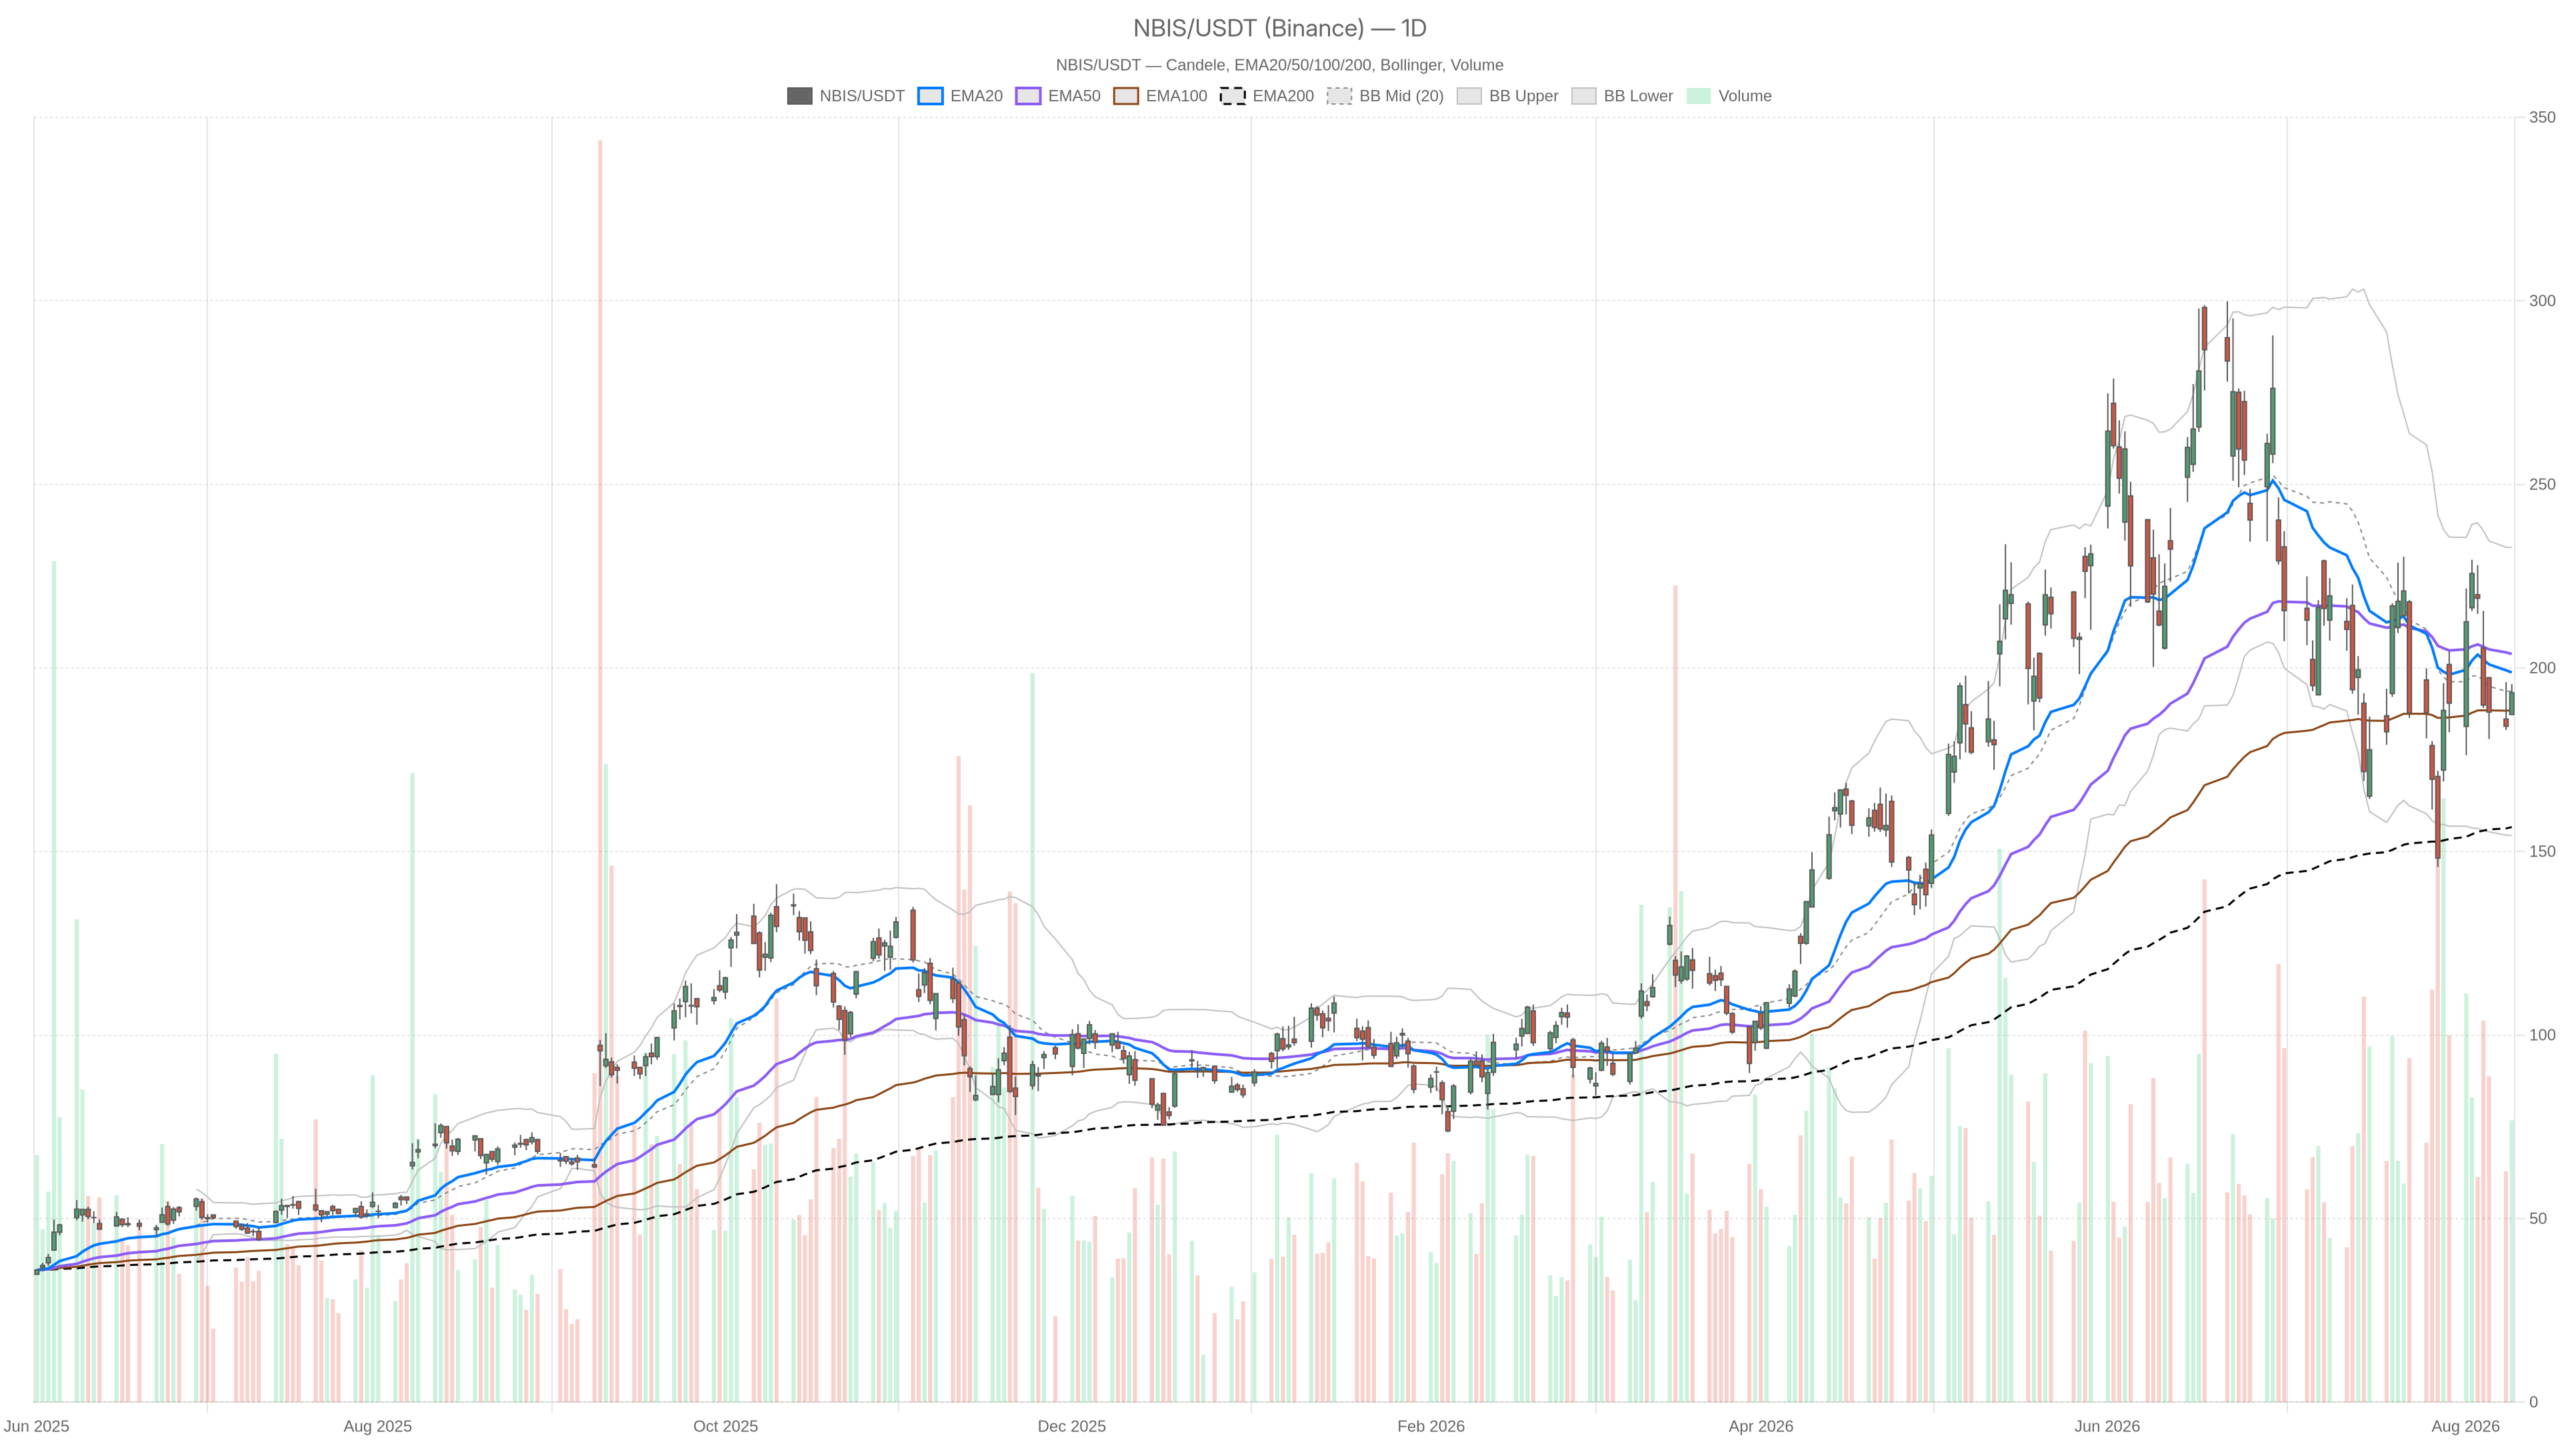
- NBIS closed at $193.23, below the 20-day EMA at $198.78 and 50-day EMA at $203.81, while the 200-day EMA at $156.66 remains far beneath spot
- Daily RSI at 47.55 signals indecision — momentum has cooled without flipping into genuine weakness
- Daily ATR at 24.20 represents over 12% of share price, making conventional level-to-level thinking fragile
- The $194.70–$196.78 zone is the immediate resistance battleground across multiple timeframes
- Q2 earnings on Aug. 12 are the binary event the market is unwilling to commit ahead of
Nebius Stock daily structure: correction inside a larger uptrend
The daily chart shows a textbook correction within a strong long-term uptrend. Price sits pinned at equilibrium while momentum cools without breaking down. Nothing is broken, but nothing is confirmed either.
Momentum indicators point to stabilization
Daily RSI at 47.55 is the cleanest expression of indecision. It sits just under the midpoint, meaning momentum has cooled without flipping into genuine weakness. There is no oversold bounce setup and no overbought exhaustion. The market is simply waiting for a catalyst.
The daily MACD adds nuance. Its line at -5.98 remains below zero, so the medium-term momentum picture is still negative. However, it now sits above its signal at -7.05, producing a positive histogram of 1.07. That is an early-stage momentum recovery attempt, not a trend reversal. Corrections often print exactly this signature before either resolving higher or rolling over again.
Bollinger Bands frame the range with unusual clarity. The midline sits at $193.63, essentially where price closed. The upper band is at $232.84 and the lower at $154.41. That band width of roughly $78 speaks to how violent recent volatility has been. Price pinned to the midline is the definition of equilibrium. Neither side has claimed the session.
Volatility itself is the dominant variable. Daily ATR at 24.20 implies an average true range worth more than 12% of the share price. Therefore, conventional level-to-level thinking becomes fragile. A single session can travel from the pivot to the outer bands. Position sizing, not direction, is the first-order problem here.
Daily pivots tighten the immediate map: pivot point at $192.05, resistance at $196.78, and support at $188.49. Price closed above the pivot, a marginal intraday positive. Still, with ATR near 24, these levels are more reference points than barriers.
Nebius Stock hourly chart complicates the bounce narrative
The hourly chart leans bearish despite confirming daily neutrality. The EMA stack slopes lower across all periods, and buyers are working against the intraday trend, not with it.
NBIS closed the 1H bar at $192.81, above the 20-period EMA at $191.85. However, it remains below the 50-period EMA at $195.85 and far under the 200-period EMA at $204.35. That EMA stack is unambiguously bearish.
Hourly RSI at 49.17 mirrors the daily reading almost exactly. Momentum is balanced at both scales, which is rare and telling. Meanwhile, the hourly MACD shows the same improving-but-negative momentum as the daily. The histogram sits at 1.31, with the line at -2.56 above the signal at -3.87. The two timeframes agree on stabilization rather than recovery.
One detail deserves attention. Price closed at $192.81 against an hourly upper Bollinger band of $193.61, with the midline down at $188.70. In other words, the recent push has already stretched to the top of its short-term envelope. Continuation from here requires fresh demand, not just mean reversion. Hourly ATR of 4.55 shows how quickly that envelope can be redrawn.
NBIS 15-minute execution context: buyers active into resistance
The 15-minute chart shows the most constructive short-term flow across all timeframes. However, the move is already pressing into overhead resistance that caps further upside without fresh demand.
RSI at 59.98 leans bullish. The MACD line at 0.61 sits above its 0.52 signal with a small positive histogram. Price at $192.81 trades above both the 20-period EMA at $190.71 and the 50-period EMA at $190.54, which have effectively converged.
At the same time, the 15-minute 200-period EMA at $195.28 caps the move. That level sits just under daily resistance at $196.78 and above hourly R1 at $194.70. Consequently, the $194.70–$196.78 zone is the immediate battleground. With 15m ATR at only 1.61, that band sits within a handful of bars of current price.
Bullish scenario for Nebius Stock
The bullish case rests on converging momentum signatures across all timeframes. All three show MACD histograms turning positive, and the long-term 200-day EMA at $156.66 remains a distant floor. A decisive reclaim of the daily 20-day EMA at $198.78 would be the first genuine sign that the corrective phase is ending. Above that, the 50-day EMA at $203.81 becomes the real test.
The news backdrop offers fuel. CoreWeave’s record Q2 has been read across into Nebius as evidence of surging cloud infrastructure demand. Nebius reports Q2 on Aug. 12, and options traders have been positioning for upside into the print, according to Barchart-based commentary. Sell-side and independent analysis has also framed NBIS as a Strong Buy ahead of the quarter. They cite AI infrastructure growth, Meta deals, and NVIDIA backing against execution risk. A strong beat with credible guidance would give the daily chart the trigger it currently lacks.
Bearish scenario for Nebius Stock
The bearish case is structurally simpler than the bullish one. The multi-week downtrend remains intact, and the hourly EMA stack proves it. Failure at resistance would keep the corrective structure firmly in control.
Michael Burry disclosed a short on Nebius Group at $211.77, describing the bearish bets as “a bit like shooting fish in a barrel.” That is a sentiment marker, not a technical one. Still, it sharpens the focus on execution rather than narrative.
Key breakdown triggers
Technically, failure at the $194.70–$196.78 resistance shelf would keep the corrective structure intact. A break below daily support at $188.49 would then open the lower half of the daily Bollinger range, with the lower band at $154.41 as the extreme reference. On the other hand, losing the hourly Bollinger midline at $188.70 would neutralize the short-term bid quickly. Any sustained move back under the 15-minute EMA cluster near $190.50–$190.70 would be the first crack.
Overall, this is a genuinely mixed tape and should be treated as such. The daily regime reads neutral, the hourly trend reads bearish, and the 15-minute flow reads mildly bullish. That conflict is not noise. It reflects a market unwilling to commit before earnings. With daily ATR near 24 and a binary event on the calendar, the distribution of outcomes is wide in both directions. Volatility, not conviction, is the defining feature of Nebius Stock at $193.
FAQ
What is the technical outlook for Nebius Stock ahead of Q2 earnings?
The daily chart shows a neutral structure with a bearish tilt in the intermediate term. Price sits below both the 20-day EMA ($198.78) and 50-day EMA ($203.81), while the 200-day EMA ($156.66) remains a distant floor. Daily RSI at 47.55 reflects indecision, and MACD is showing early-stage momentum recovery without confirming a reversal. The market is in a holding pattern awaiting the Q2 earnings catalyst on Aug. 12.
What are the key support and resistance levels for NBIS?
Immediate resistance sits in the $194.70–$196.78 zone, where the hourly R1 pivot, the 15-minute 200-period EMA, and the daily R1 pivot converge. Above that, the daily 20-day EMA at $198.78 and 50-day EMA at $203.81 form the next hurdles. Key support lies at $188.49 (daily S1), with the hourly Bollinger midline at $188.70 reinforcing that floor. A breakdown below opens the lower daily Bollinger band at $154.41 as the extreme reference.
When does Nebius report Q2 earnings and what is expected?
Nebius reports Q2 earnings on Aug. 12. Options traders have been positioning for upside into the print, and sell-side analysis has framed NBIS as a Strong Buy, citing AI infrastructure growth, Meta deals, and NVIDIA backing. A strong beat with credible guidance would provide the trigger the daily chart currently lacks.
Disclaimer: This article is for informational purposes only and does not constitute financial advice, an investment recommendation, or a solicitation to buy or sell any financial instrument or cryptocurrency. The analysis provided is not indicative of future results. Investing in crypto assets and financial markets carries a high risk of capital loss. Always do your own research (DYOR) and consult a qualified financial advisor before making any decision.
Article produced with the assistance of artificial intelligence and reviewed by the editorial team.
