While the month of June closed in the red with a slight loss since the opening, with a decrease of just over 3%, the second quarter of 2020 was positive for the price of Bitcoin. The closing of the semester is also positive.
After a slow start of the first quarter, closed in negative and with a loss of 10% due to the decline that developed in March, the second quarter shows a positive sign for the price of Bitcoin with an increase that goes beyond 42%. After three consecutive quarters downwards, the second quarter of 2020, which has just ended, is the first for about a year to be preceded by a positive sign.
Since the beginning of the year, Bitcoin continues to confirm itself as the best asset. It does even better than gold, which with the increases that are developing in recent days is back to almost $1,800 per ounce, the highest level since 2012.
Gold is the other positive asset, with a gain of over 16% since the beginning of the year. A leap also for the S&P 500 which with a gain of over 20% closes the third-best quarter, with a performance that had not been recorded since 1975.
In a context of uncertainty that continues to influence investments and investors, Bitcoin continues its path towards the high end of the price range. From the lows of March 13th, Bitcoin recorded prices above $9,000, which continue to remain a very important support with a price fluctuation that seems to be more of a consolidation anticipating an upcoming rise.
Despite this fluctuating moment, Bitcoin continues to give indications of holding the levels of support in the medium and long term. This is reflected positively throughout the sector, although from last Wednesday’s levels on a weekly basis the weakness continues to prevail. Among the top 20, only Crypto.com (CRO) climbing +2% and Leo Token (LEO) gaining 8% are the positive ones on a weekly basis.
Volumes continue to fall, reaching the lowest levels in recent weeks. In the last 24 hours, just over $45 billion have been traded.
Yesterday Bitcoin traded 1.180 billion dollars in counter value. Excluding weekend trades, this is the lowest volume since the end of January.
Volatility also continues to fall, which in these hours updates, albeit by a fraction of a decimal point, the lowest point of the last 10 months, thereby falling below the lows of the last days of September.
Low volumes and falling volatility show that operators are waiting for a clear directional signal.
This calm anticipates a strong directional movement. It is necessary to continue to follow medium and long-term support and resistance in the coming days.

Today shows a balance between positive and negative signs.
Going through the list of the first 30, the best increase is that of Stellar (XLM) which gains 3%. Also Iota (IOTA) is doing well with +5%. Remaining above the parity are VeChain (VET) 0.5%, which today celebrates the second year since the launch of the mainnet, and Tron (TRX) that with an increase of 0.3% tries again to attract attention, involving fans with new initiatives launched in the last few hours. Among the privacy coins, Monero (XMR) is doing well, rising by 0.5%.
Meanwhile, Bitcoin Satoshi Vision (BSV) is falling 1%, following yesterday’s rise.
Neo (NEO) and Ethereum Classic (ETC) also go down. But among the top 30, the worst is Compound (COMP) which drops by 8% and goes back below $215. The speculation and the profit-taking prevail for Compound which remains very volatile.
Nevertheless, Compound maintains the leadership of the DeFi sector with just under 600 million deposits locked in DeFi, 37% of the dominance of decentralized finance.
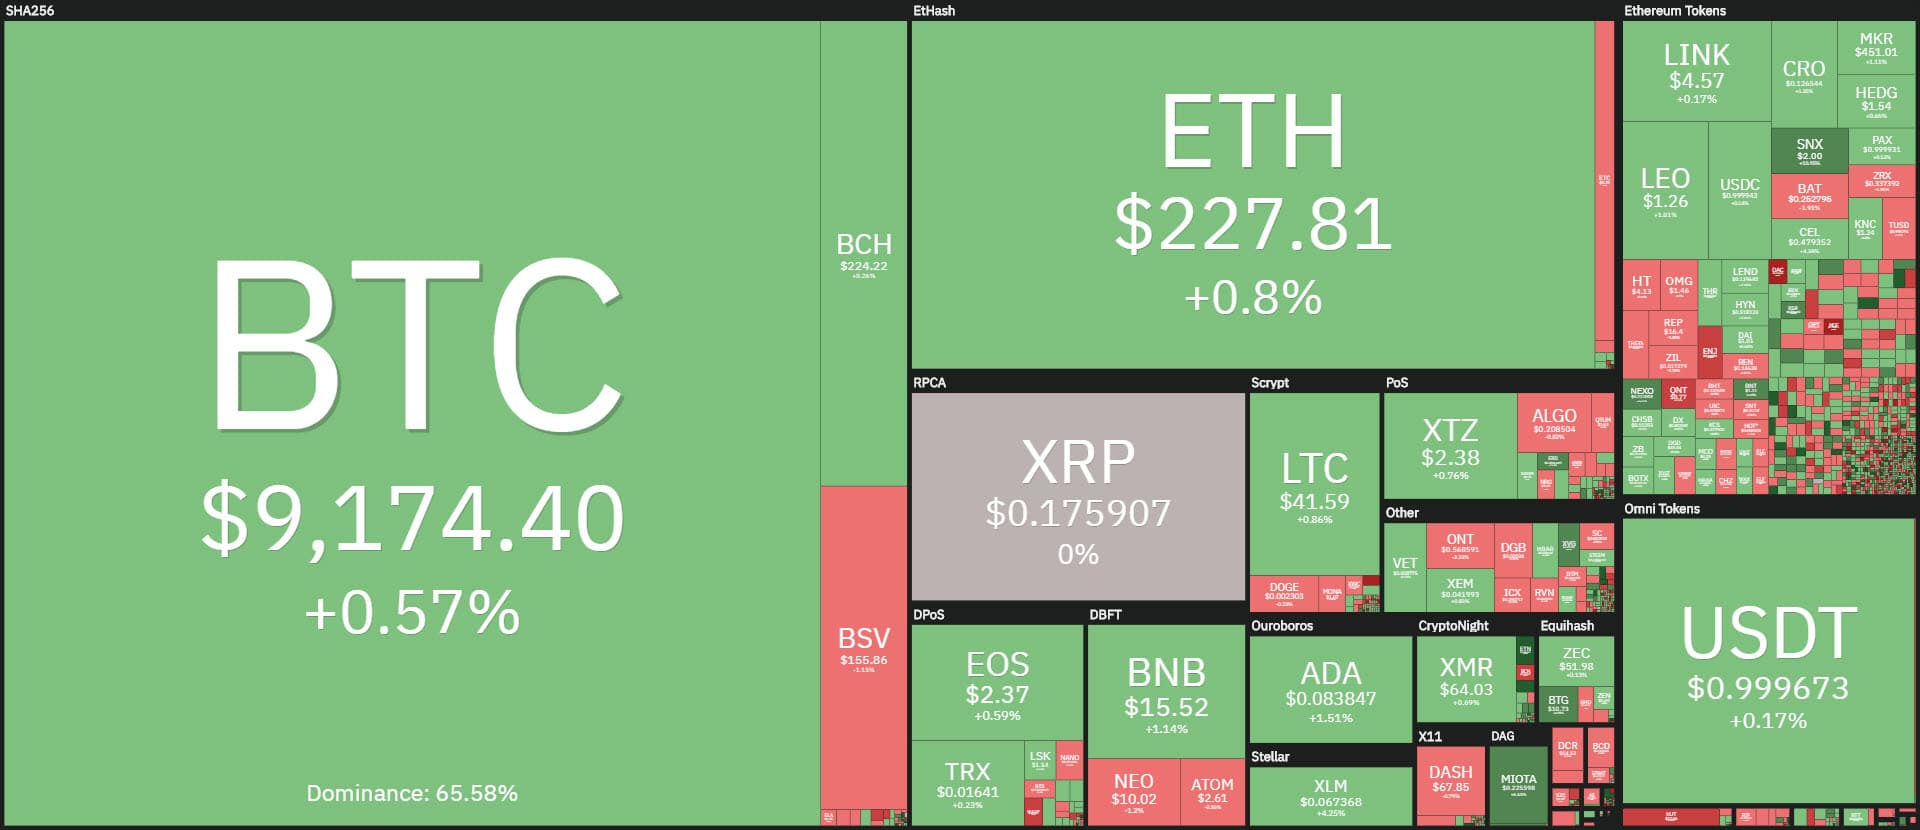
The total market cap remains above 260 billion dollars.
The dominance of the top 3 is unchanged from yesterday’s levels. Ripple updates its dominance to 2.9%, lowest levels since December 2017.

Bitcoin (BTC)
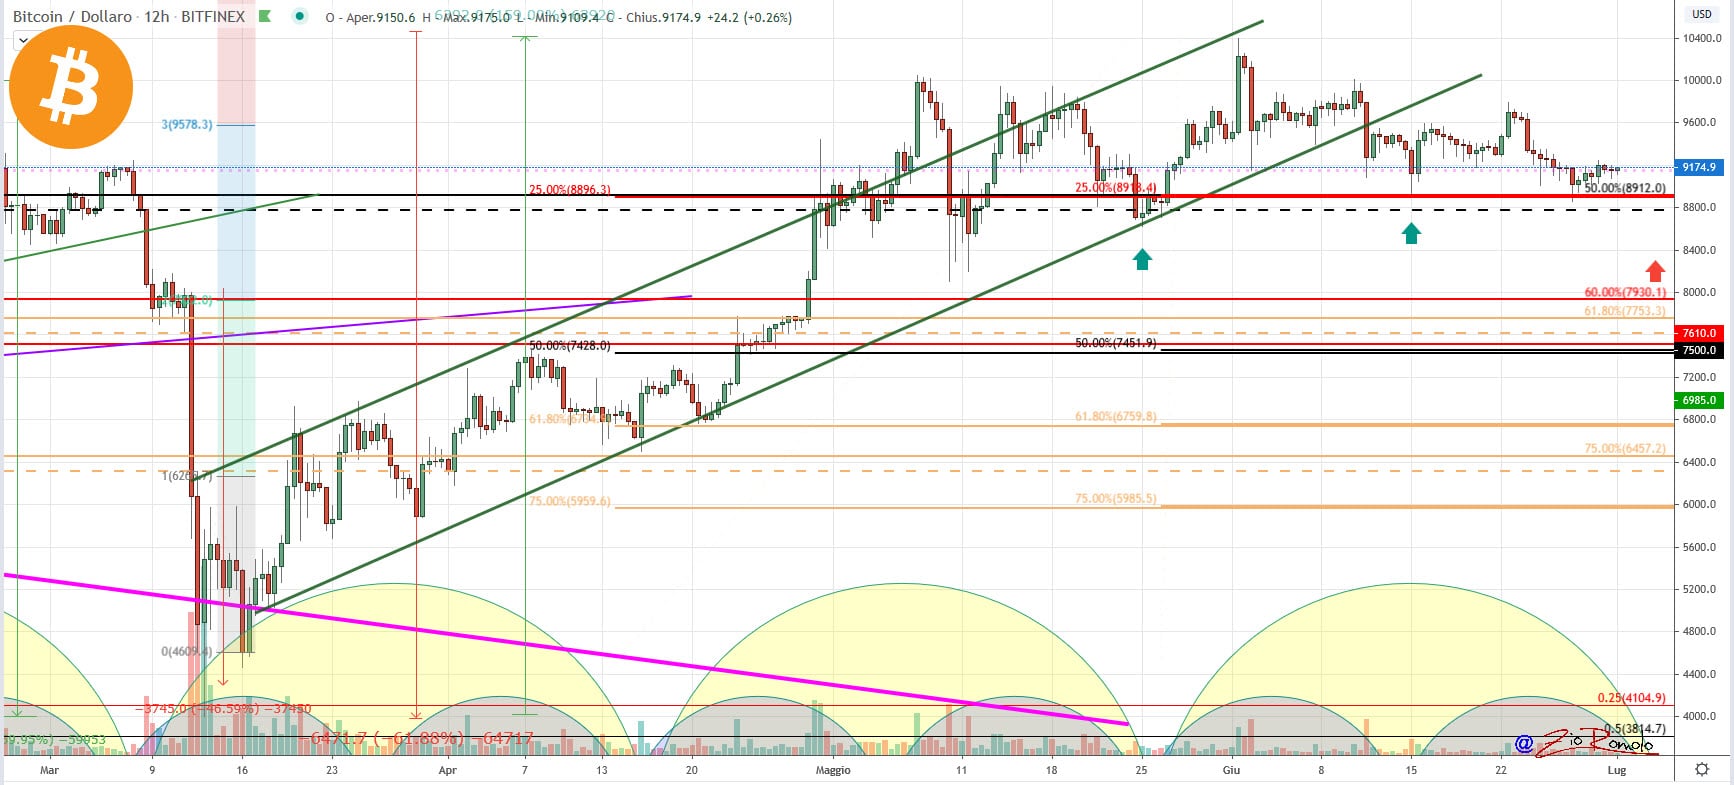
Bitcoin continues to confirm the holding of $8,900, a level where hedging is increasing for downward put options, which are in fact rising above $9,050 to protect against a possible decline.
Upward call positions continue to prevail with first levels of resistance in the $9,700 area and then those even more solid between $9,800 and $9,950.
Levels that coincide with the static resistance and with the highs tested between May and June, 5 times, in which only once was the psychological resistance of 10,000 dollars exceeded at the beginning of June, then prices fell below these levels.
Upward and downward, these are the levels to monitor.

Ethereum (ETH)
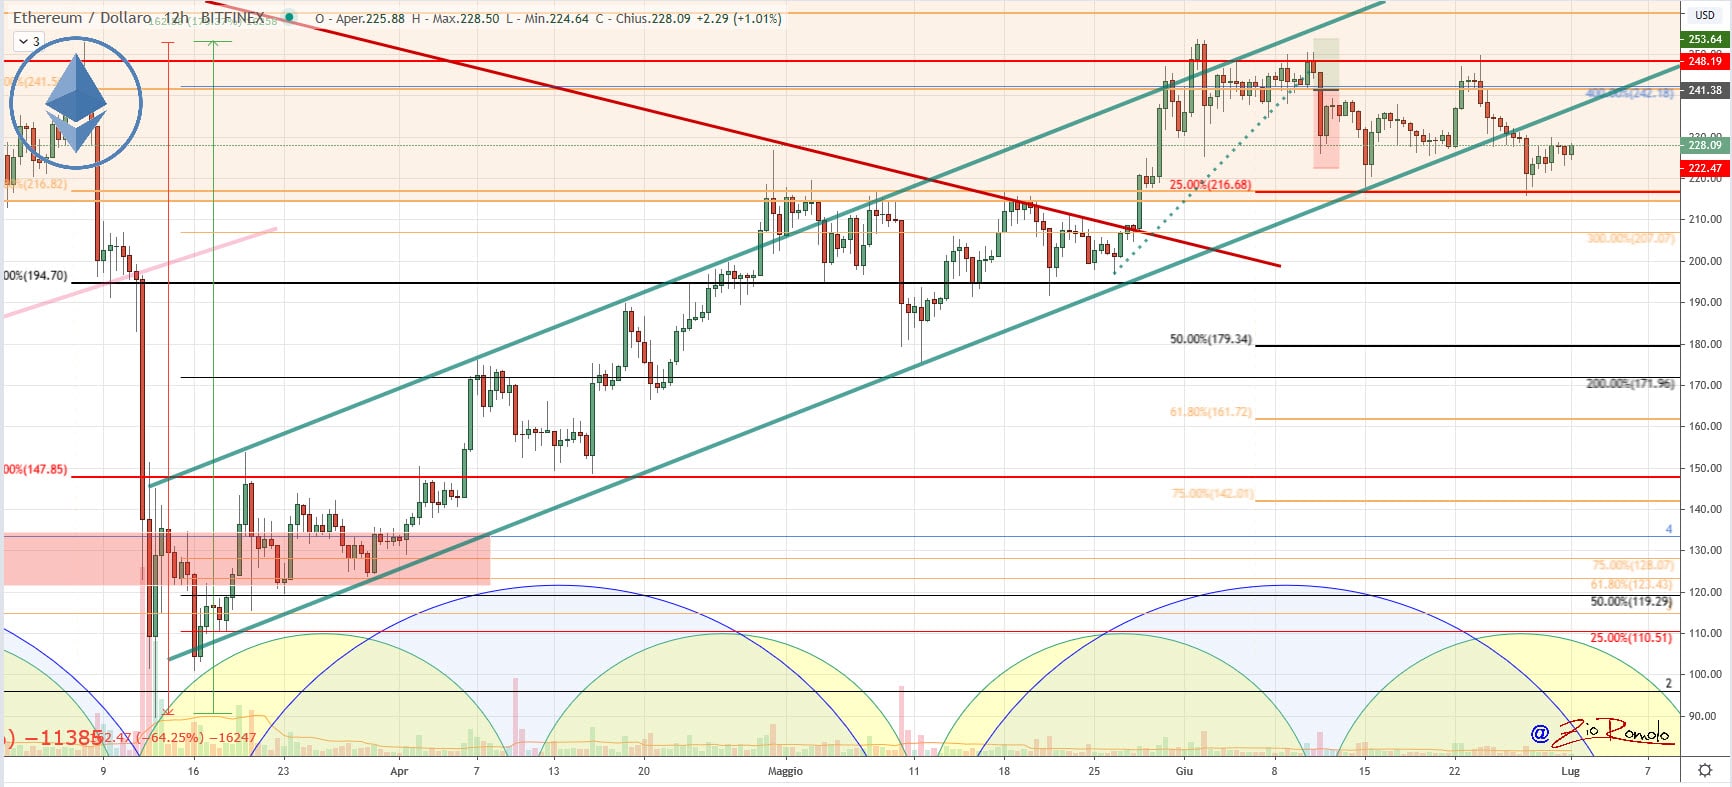
Ethereum confirms the $215-220, but ETH also suffers from low volumes and this is not comforting. It is necessary to recover the 235 dollars that coincide with the bullish dynamic trend line violated last Friday.
With regard to options placements of professional investors, the risk coverage is in the $215-220 area where hedging at this level is definitely prevalent.
Upward, however, it is necessary to go above $235, which coincides with the dynamic bullish trend line to then go to attack the June highs in the $254 area.
Unlike Bitcoin, professional investors prefer to protect themselves more against downward movements. Unlike Bitcoin where upward hedging prevails, for Ethereum upward hedging positions are spread over several levels ranging from $230 to $275, which coincide with the relative highs at the end of February.


