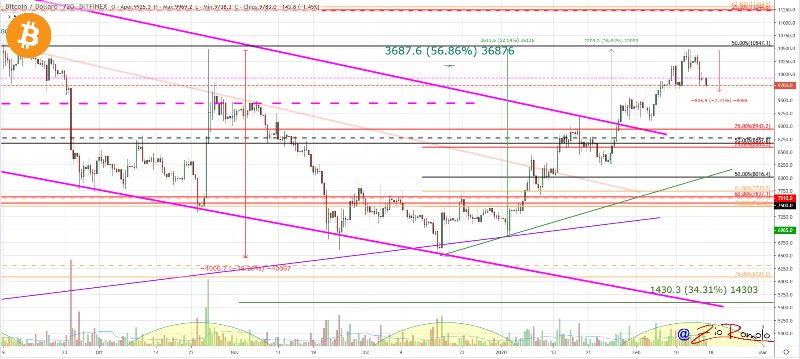
Bitcoin remains the beacon of reference for the entire crypto industry, however, with its latest downward movements, BTC has proved that the $10,500 threshold is a very strong technical level which requires significant volumes to be violated.
Over the last few days, volumes have been slowly decreasing, despite remaining well above the highest levels since the beginning of the year.
These last 48 hours are seeing a strong backlash for the whole sector with a reversal that will have to be carefully evaluated in the coming days to understand if it’s a healthy reversal: is such an uptrend sustainable? This turnaround at the moment can be justified by the profit taking following the double or triple-digit gains within a little less than two weeks.
Ongoing declines from the tops recorded between Thursday and Friday last week see most of the big names lose about 10%.

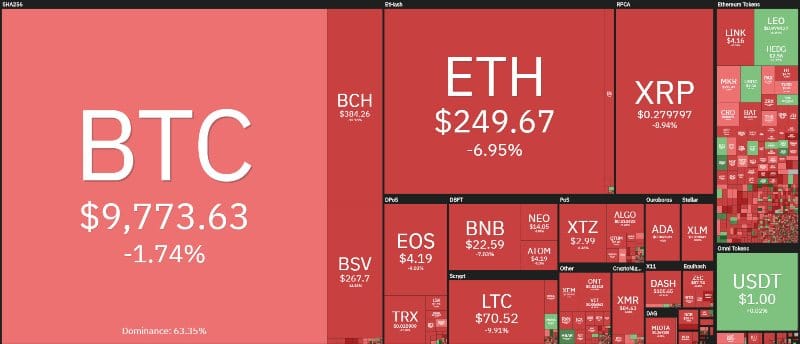
As a result, the third week of February sees an opening with over 90% of the cryptocurrencies in red.
Among the major currencies, Bitcoin is the one that loses the least, despite having made a downward movement of about 7% from the highs on Thursday 13. Same percentage for Ethereum which loses 7% but on a daily basis. From the highs recorded between Friday and Saturday, Ethereum loses 17%.
The day was even worse for Ripple (XRP) which lost 10%, Bitcoin Cash (BCH) 14%, like Bitcoin Satoshi Vision (BSV) and Eos (EOS). As well as Cardano (ADA), Stellar (XLM), TRON (TRX) and Dash (DASH) that fall between 11 and 13%. These are the worst among the top 20.
This situation is an indication of how the profit taking is taking its toll. Despite the strong setback, this does not affect the increases of the past few days that have seen triple-digit gains.
This is the case of Hedera Hashgraph (HBAR), which between Tuesday and Wednesday of last week earned 300% in just over 24 hours and then recorded a reversal that made it lose 50% from Wednesday’s tops. Despite this strong volatility that sees Hedera in positive territory with a +5% in the last 24 hours, the retreat of Hedera and other cryptocurrencies today does not affect the bullish trend that has been consolidating in recent days and which has now started for several weeks and since the beginning of 2020.
Despite the declines of the last few hours, the volatility is not subject to particular fluctuations, remaining at the lowest levels of the last five months, just under 2.5% on a daily basis on a monthly basis.
Volumes, despite a small regression, remain very high. In recent days, they have stabilized over 200 billion dollars a day, while currently we are at 180 billion traded in the last 24 hours, substantial levels considering that the reference starts on Sunday.
The market cap, after exceeding the threshold of 300 billion dollars in recent days which had not been seen since last August, has fallen back slightly to 280 billion.
As happened in the last two weeks, with a market supported in particular by the elevations of the altcoins that have gained market share, in recent hours it is the altcoins to lose more ground and this causes Bitcoin to gain dominance which is back above 63.3%.
Despite the strong retreat of Ethereum, its dominance remains one step away from 10%, levels that had not recorded since last July. Ripple maintains its dominance above the lows recorded in early February but far from the highs of October when it reached 6%: today it is at 4.5%.

Bitcoin (BTC) movements
The profit taking on Bitcoin are making prices drop to test the former resistance level, now support, at $9,600. This is a healthy setback because intense rises without a undulating movement can become very dangerous. Hence this retracement is welcome, although it is necessary to confirm the levels of support built up during the last 15 days’ elevations.
It is important for BTC not to go below the $9,500 threshold and the $8,800 threshold thereafter. Only a fall below this level would give a first warning signal for the bullish trend started from the relative lows of January 2nd.
A return above the 10,500 threshold requires important new purchasing volumes.

Ethereum (ETH)
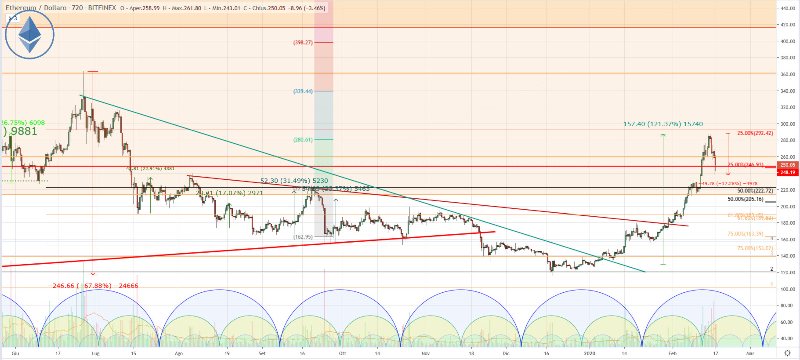
Since the beginning of the year, Ethereum has recorded a 120% gain with Friday’s tops, but with the setback of the last 48 hours it is seeing prices slide to test the former long-term resistance level threshold of the $235 violated with the mid-week rises.
For ETH it is necessary to stay above $230-235 and not extend the declines below $225 in order to keep the uptrend built since the beginning of the year intact.
Despite the strong declines of the last few hours, Ethereum as well as Tezos (XTZ) and Chainlink (LINK) among the top 20 in the capitalization charts, maintain their weekly positive performance with double-digit gains.
For Ethereum, the $285 benchmark remains important in the event of a continuation of the uptrend. On the contrary, a return under $225 would give a first sign of weakness that has never been recorded since the beginning of 2020.

Ripple (XRP)
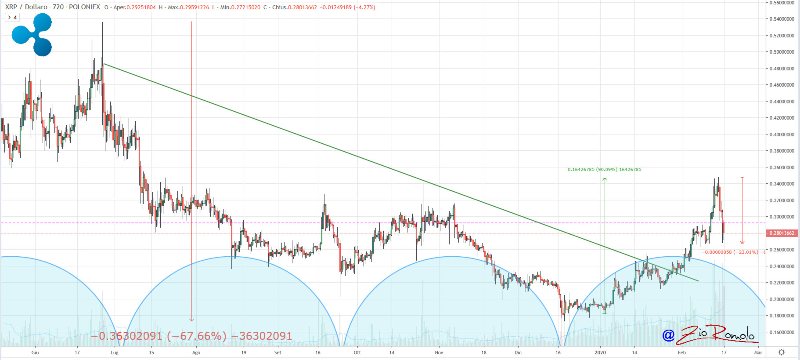
With the rise of the last few days, Ripple has gained 90% from the January 2nd lows. The strong jump between Thursday and Saturday has led XRP to rise above 34 cents. This level is proving to be very challenging indeed. Already in July, as well as at the end of October, XRP had rejected the bullish attacks, which was the case here too, to the extent that now Ripple has declined to test the 26 cents threshold with a 20% drop in 72 hours.
Ripple needs to be monitored to see if the last rise has been a reflection of the rises in the sector in recent days or if it having its own recovery.


