The first positive week, after three consecutive downwards, is behind us; to find a similar intensity and movement for Bitcoin and the other cryptocurrencies it would be necessary to go back to the beginning of 2018.
Friday saw the second day in a row fail with a double-digit increase: in the evening, Bitcoin’s prices fell below $6,000 after having climbed to close to $7,000 during the day.
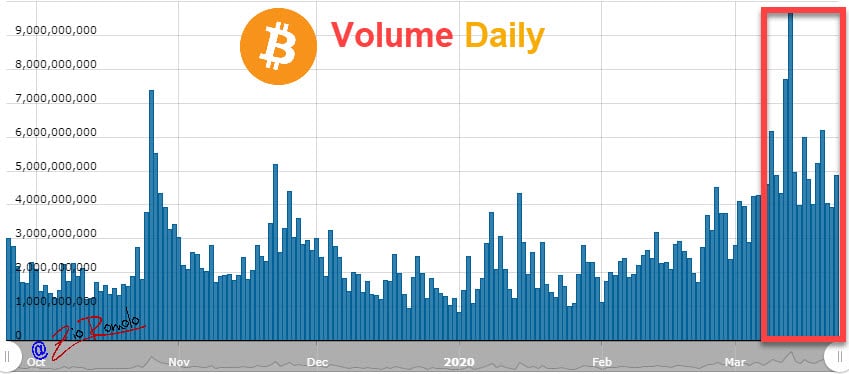
Volumes on Bitcoin remain strong and are accompanying the upward and downward movements on a daily basis.
Total volumes remain above the average, over $120 billion on a daily basis. It is a comforting fact and a proof of reaction that is affecting not only BTC but also the whole sector.
The last week of March sees a prevalence of positive signs, after being shaken in the second half of the day by the Federal Reserve’s announcements of a new intervention to support the US economy and finance.
This, in addition to having immediate repercussions on the stock markets, was also reflected on cryptocurrencies, in particular on Bitcoin, which in some places rose even more than 5% revising the $6,600, the highs recorded during last week’s rebound.
It is necessary to understand if the $6,000 will be sustained in the next few hours or if, as happened last week, it is an impulsive movement due to the euphoric repercussions of a move by the US central bank that has no precedent in history.
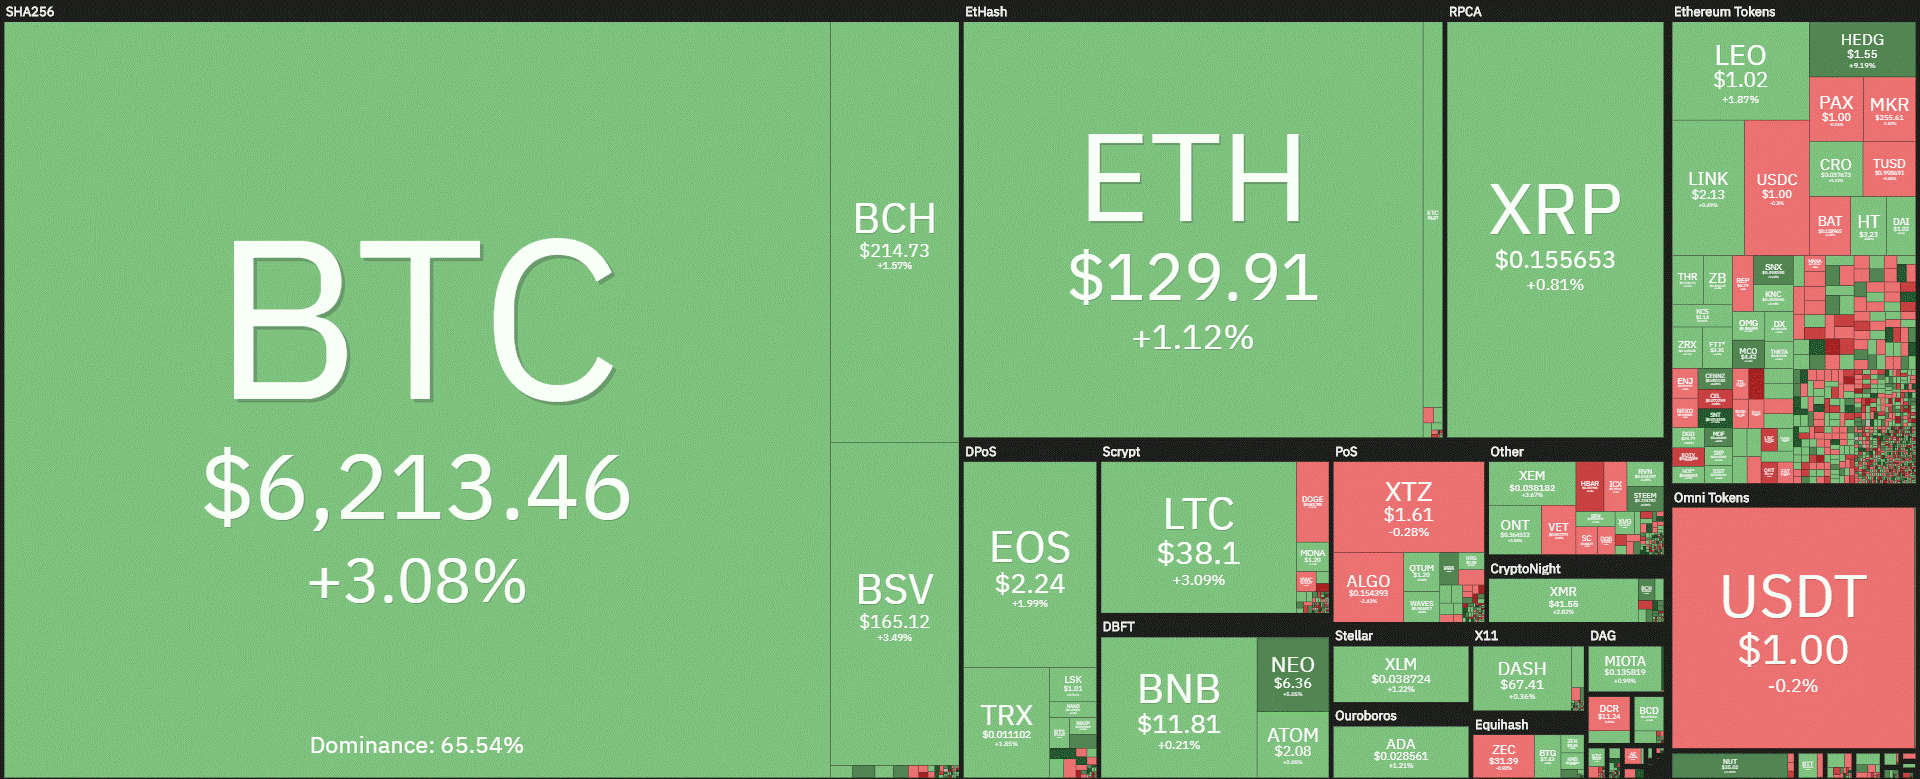
The day sees a prevalence of green signs with over 70% above parity, with no particular double-digit increases. Among the big ones are Monero (XMR), Litecoin (LTC) and Bitcoin (BTC), which recorded increases of more than 2%.
Monero is in contrast with the other privacy coin, Dash (DASH), which lost 1.5%. Monero, with the movements of the last few days, overtakes Dash and moves to 17th position in the ranking of the major capitalized, while Dash slips to 19th position.
On the opposite side of the declines, not very far down, to the extent that none of the top 100 sinks with double-digit movements, it is worth highlighting the decline of Hedera Hashgraph (HBAR), -9%, the worst decline of the day.
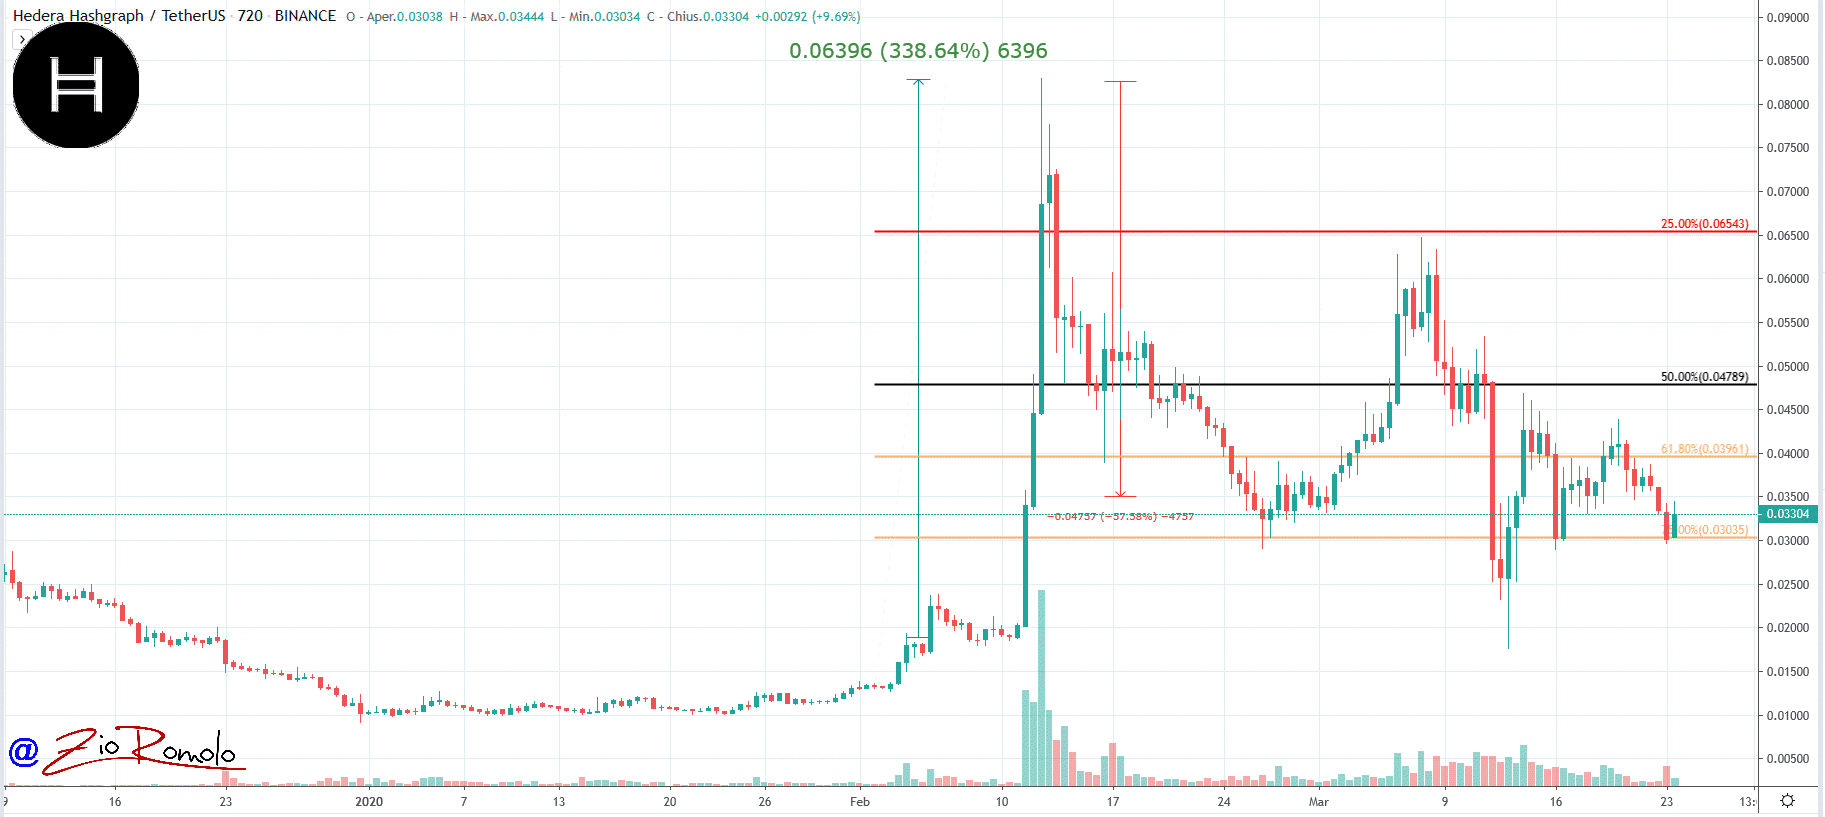
After the strong upward movement that had characterized it in the first half of February with a rally of 350% on the emotional wave of Google that formalized the entry into the executive directorate of the Hedera blockchain, with the declines of the last few days, also in progress today, HBAR marks a loss of 80% of all the movement built in mid-February. Prices are returning close to 3 cents on the dollar.
Among the best known, Enjin Coin (ENJ) also loses 4%, while Zilliqa (ZIL) falls by 2.5%. Among the top 20, the most pronounced drop is that of Tezos (XTZ) which loses a little more than 1%, but this does not disqualify Tezos which, on the contrary, maintains the 10th position in the ranking of the most capitalized.
The market cap is just over 170 billion dollars. The dominance of Bitcoin is confirmed above 65%. Ethereum recovers some ground at 8.3%, while XRP remains stable just above the 4% threshold that was violated last week, bringing XRP to the minimum levels of 2020, seen already in early February and mid-March, levels that had not been recorded since December 2017.
Bitcoin (BTC)
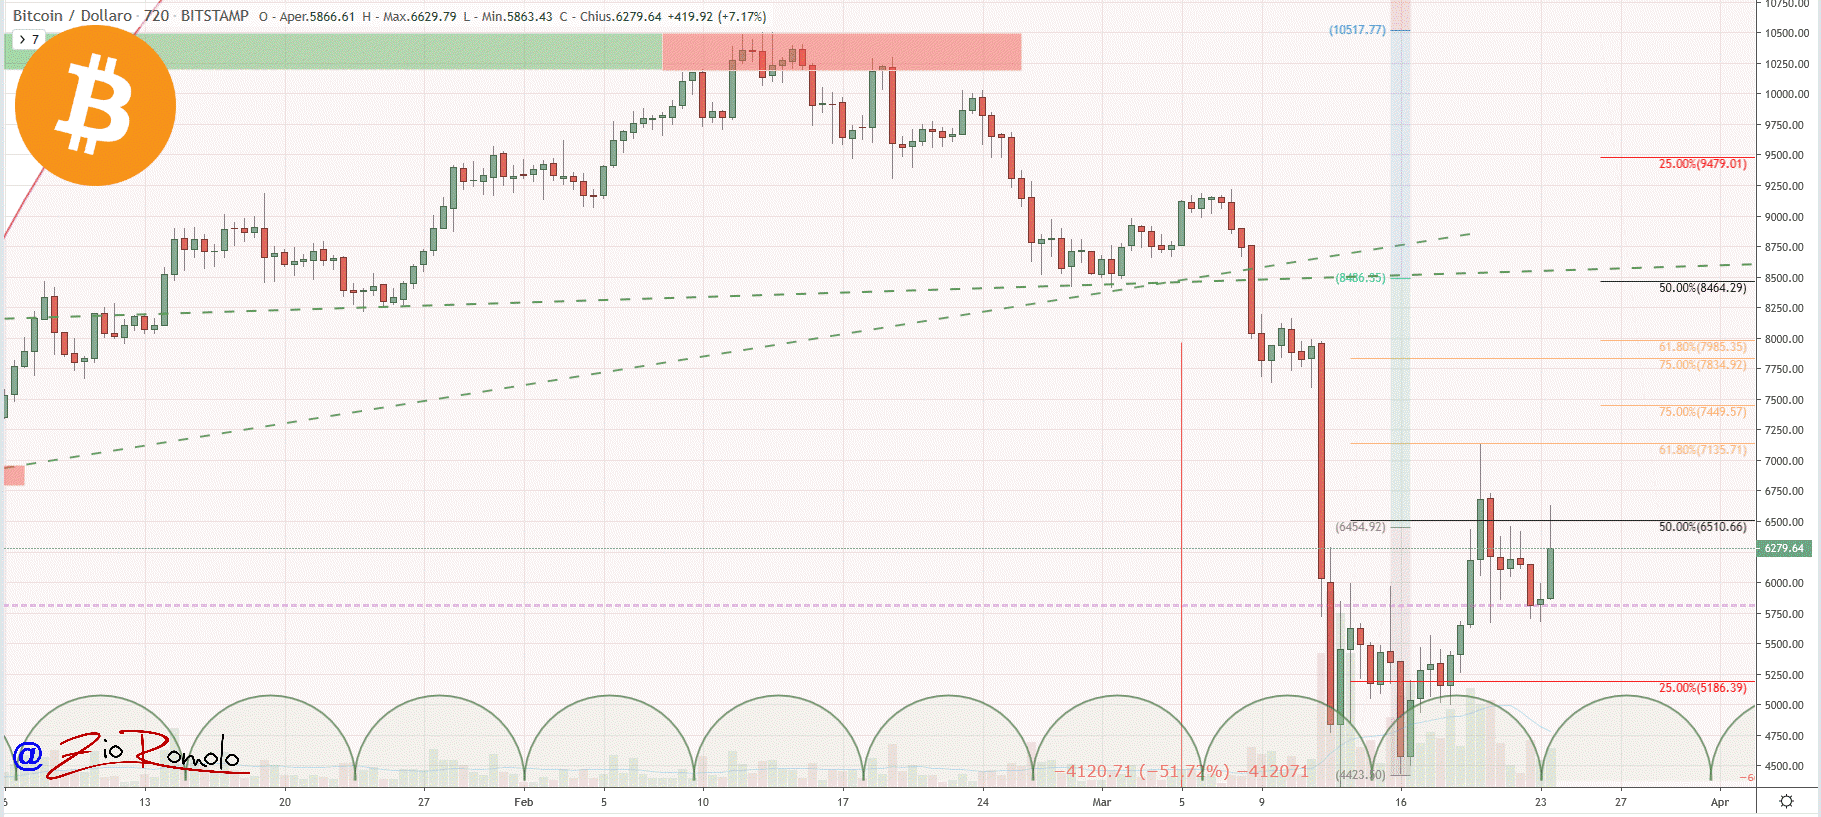
Despite the difficulties, Bitcoin tries to reverse the bearish trend that has characterized it for a month from the tops of mid-February. The low recorded during yesterday’s day just over $5,850 becomes short-term support that if held will have to give the boost driven by purchases above their own highs marked during the course of the day today, over $6,700.
A rise above this level and then over 6,900 would give a first sign of a possible bullish reversal in a monthly perspective.
Cyclically, Bitcoin seems to find itself between the closing and the beginning of a new monthly cycle that will be important to identify and then follow to understand the evolution in the coming weeks.
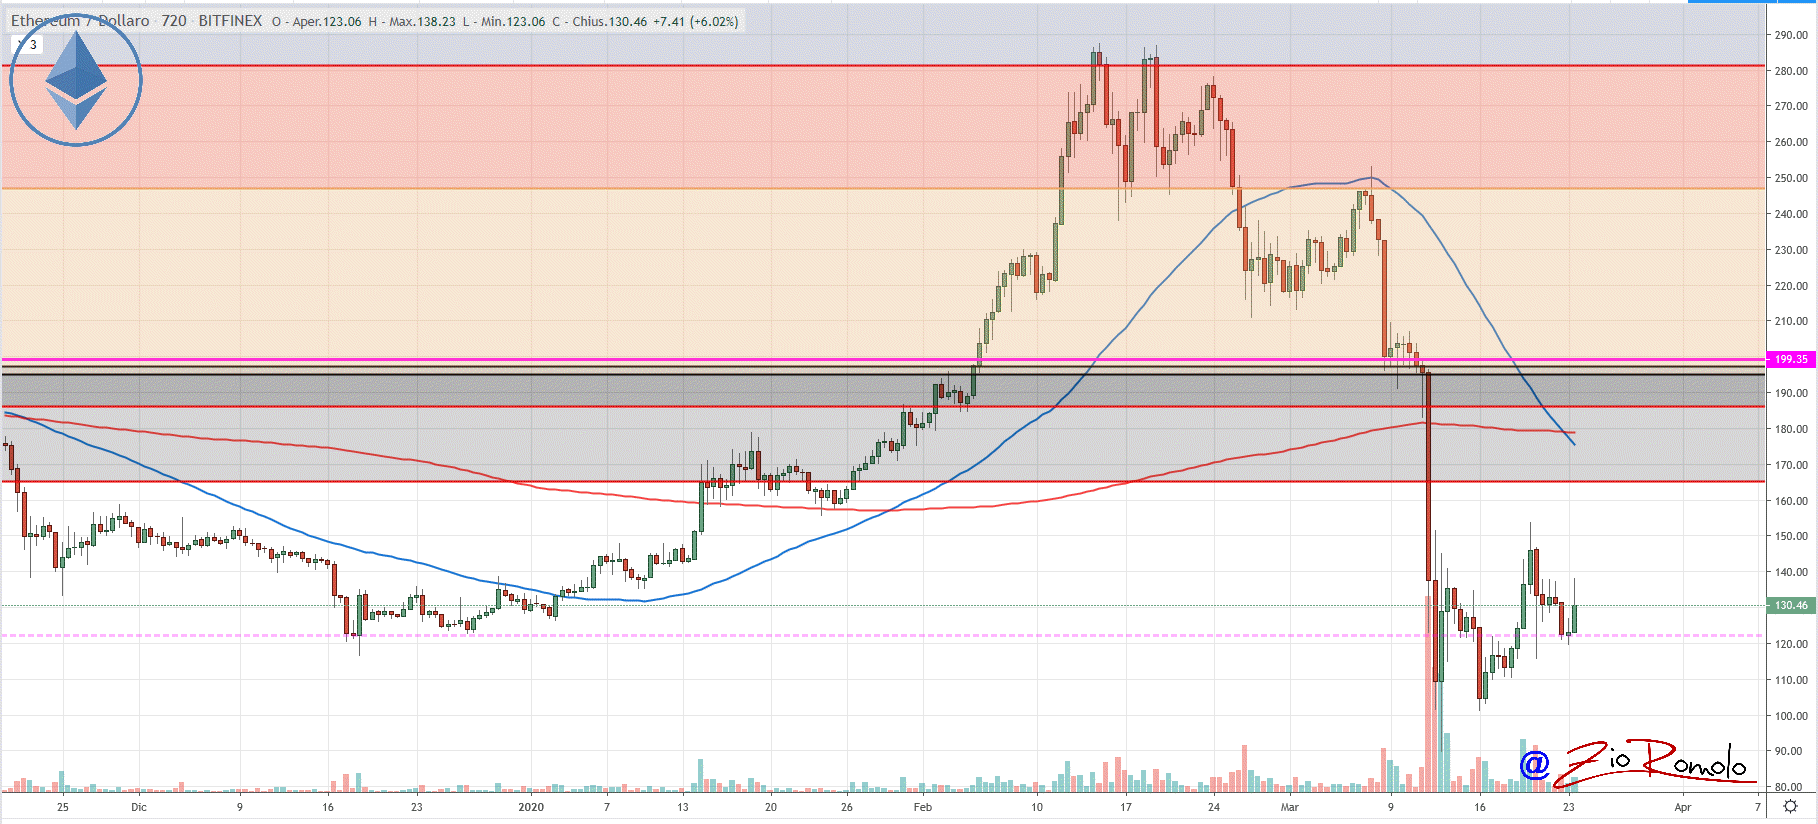
Ethereum (ETH)
Ethereum is trying to provide bullish turning points on a weekly and then monthly basis. ETH seems to experience a little more weakness compared to Bitcoin’s movement. Yesterday the price of Ether returned to test the $120 threshold, a threshold that in the coming hours and days will be monitored as a short-term support level. Ethereum would leave behind the first fears of a possible return of Bears with prices rising above $150 in the coming days.
On the contrary, a return to $115 would increase the probability of seeing prices below $100 again. Under this level, there would be more confirmations that there is still a bearish trend that started from the highs recorded on February 19th, over a month ago.


