The intense trading session that yesterday saw the US indexes close with significant declines seems to be reflected in the red-coloured cryptocurrency sector.
The US Dow Jones recorded a loss of 1.39%, a bit more than the S&P 500‘s loss of -0.56%. The only positive one is the NASDAQ which gains 0.5%.
Bitcoin and cryptocurrencies seem to be correlated with the US stock indices.
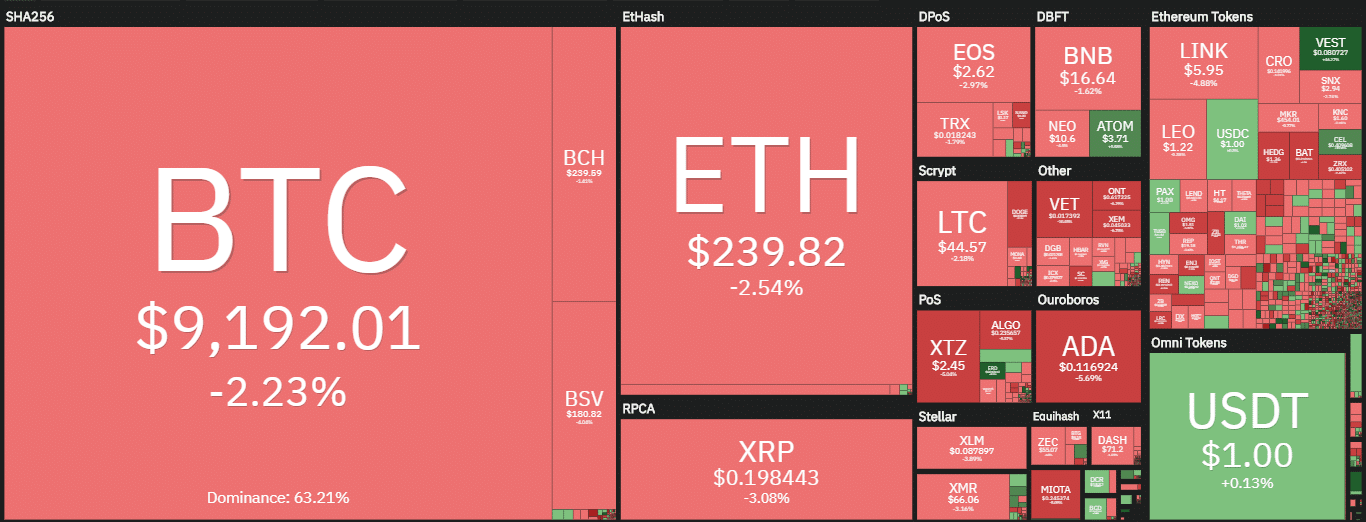
Today there is a clear prevalence of red signs, 85% of the first 100 capitalized. The only positive sign among the first 20 capitalized is the Leo token that earns 0.5%. On the other hand, there are double-digit declines, such as those of Stellar (XLM) and Cardano (ADA), which fall by more than 8%. Both without ruining the gains made in the last 7 days.
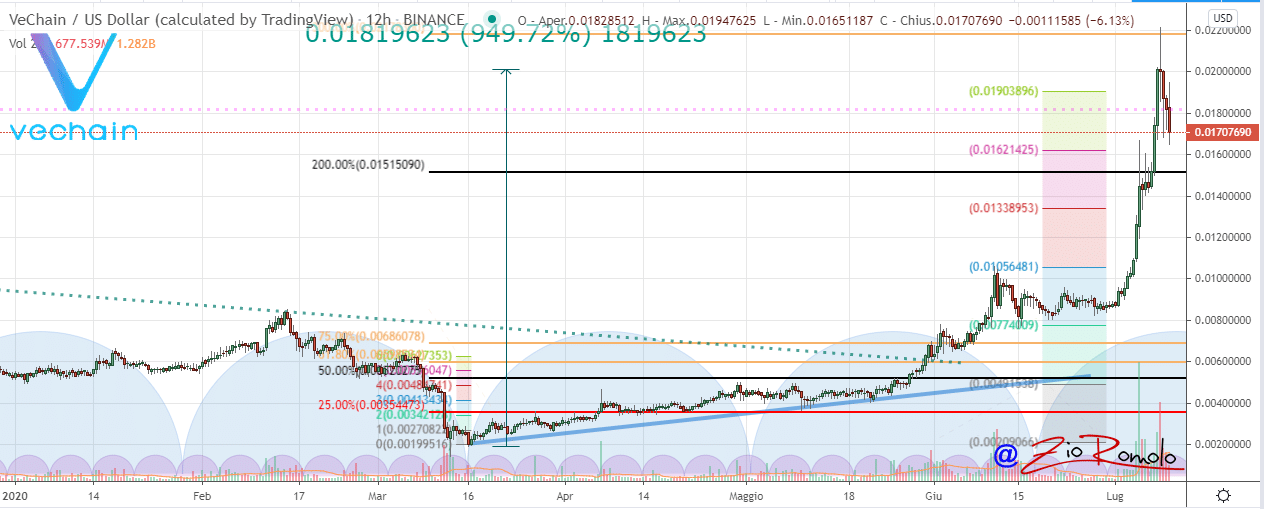
Stellar and Cardano among the top 20, together with VeChain, are the ones that register the biggest weekly increases despite today’s backward step. Stellar and Cardano have been earning 25% since last Friday, while VET is flying over 70%.
However, VeChain today drops more than 12%. With recent increases VeChain has reached $0.022, levels abandoned in July 2018, therefore the highest in the last two years. With the current profit-taking, VET is closing the gains and from the tops of July 8th, it scores a -20%. Nevertheless, it continues to maintain excellent weekly performance.
Among the best of the day, there is Elrond (ERD) which returns to climb with +33%. BitTorrent (BTT), a controversial token linked to TRON, is back with a climb of over 20%. On the opposite side, the worst drop of the day is FlexaCoin (FXC) which slides more than 17%.
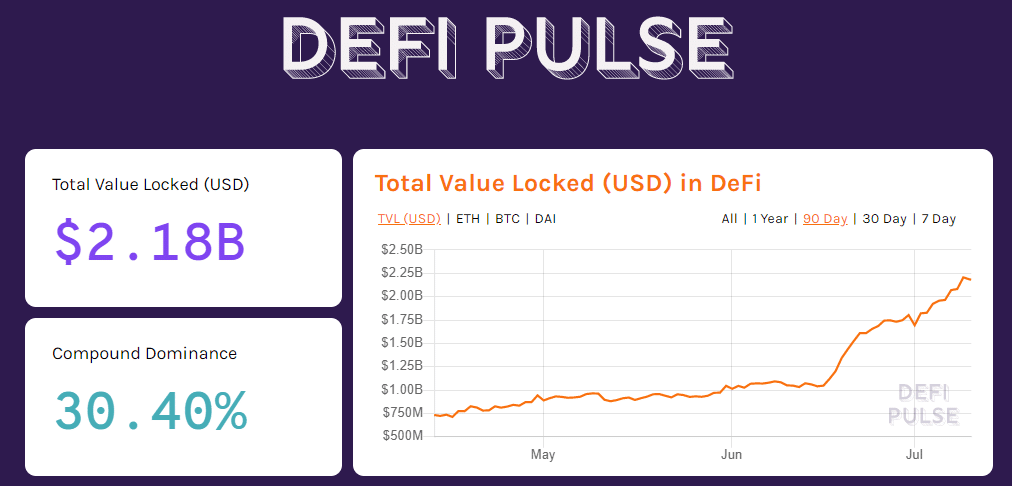
In the DeFi universe, 0x (0X), Bancor (BNT), Ren (REN), Zilliqa (ZIL) and Loopring (LRC) all drop more than 6%. A downturn in the entire DeFi sector which, however, has not diminished the successes of the last two weeks. Only yesterday there were new absolute records of locked tokens as collateral, equal to 2.7 billion dollars.
Comparing the TVL (Total Value Locked) with the levels of mid-April, when it was at just over 700 million dollars, there has been a three-fold increase in just under three months.
Compound continues to dominate at $663 million dollars locked, while Maker makes a comeback with over $615 million. Compound’s dominance falls back to 30%.
Total capitalization returns below $270 billion, with Bitcoin’s dominance falling back below 63%. Ethereum is also falling back below 10% after trying to climb above this threshold in the last two days. XRP’s recovery stabilizes at 3.3%.
Bitcoin (BTC)
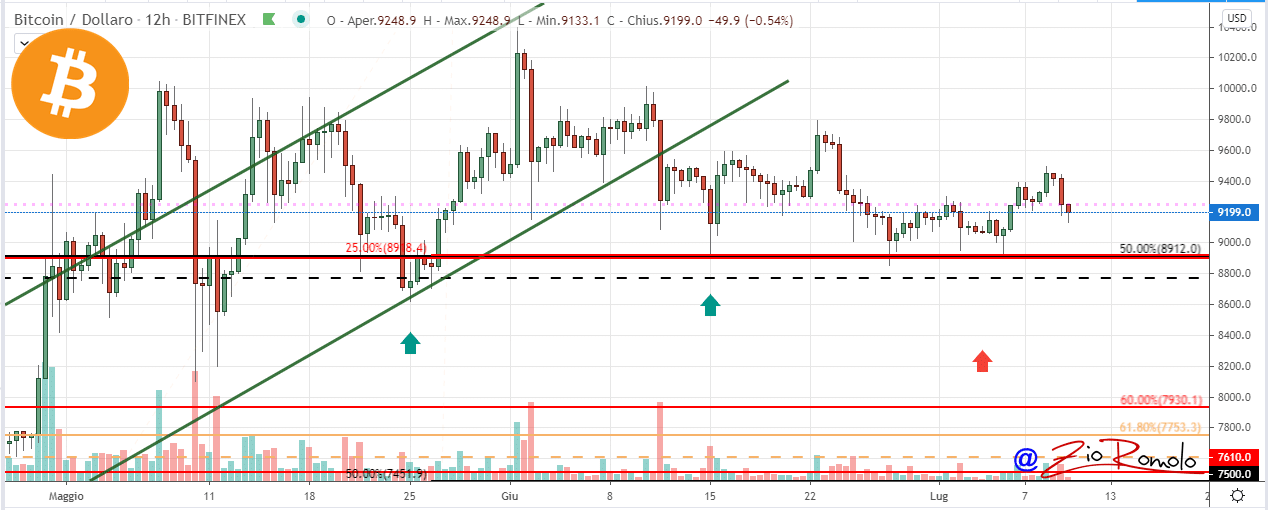
Bitcoin halves the gains made in the last two days. From Sunday’s lows, it had earned over 7%, but with the weakness of the last two days, this gain halved to 2.5%.
Sunday’s lows are a crucial level that corresponds to the 25% of Fibonacci’s retracement that takes as its reference the mid-March lows and June highs. They also seem to coincide with the start of a new cycle which could also be a sub-cycle.
The trend remains uncertain with the narrow price in a range between $8,900 and $9,500. This is an oscillation that does not indicate the possibility of the start of a new monthly cycle.
The positions of professionals on derivatives and options on Bitcoin are consolidating the first major downward hedge in the $8,900 area. The first level used for upward hedges, to be technically exceeded, is $9,350.
Unlike last week, this Friday’ is going to end with a prevalence of put positions, which means hedging any downward movements.
The Fear & Greed index oscillates around 40 points, the average recorded since the end of April, which is in line with what is happening with prices, reflecting the specular trend.
Uncertainty continues to keep the daily volatility below 1.5% on a monthly basis, one of the lowest levels of the year. Traders’ sentiment remains frozen, with no particular moves up or down.
Ethereum (ETH)
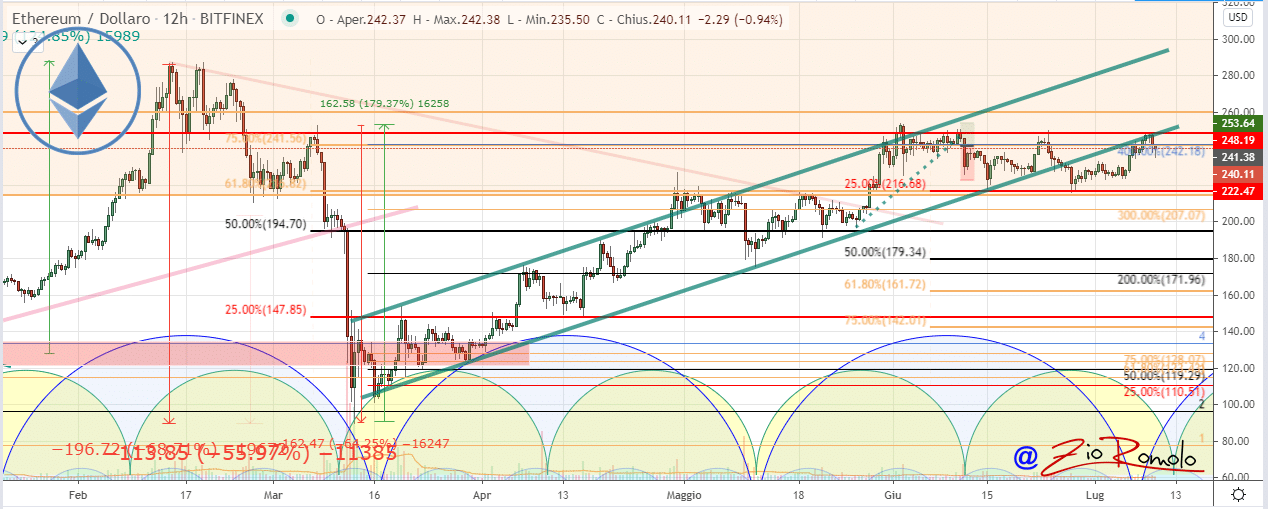
Ethereum, after having attempted to recover the $250, is once again dominated by profit-taking, causing prices to fall back in the $235 area.
For Ethereum, the new failure to climb above $250 highlights how this level is a hostile resistance that must be broken in the event of an increase. This hostile resistance is also confirmed by the peak of call hedges in the 250 dollar area.
For option positions, hedges for possible declines in the $215 area continue to prevail. But yesterday’s rise made the hedges spread by raising them in the $225-230 area. These are the levels to be monitored in the coming days and over the weekend.


