




Game Stop Stock starts the week with a bullish technical bias, but GME now faces higher event risk after its reported bid for eBay. The broader trend still favors buyers. However, stretched short-term conditions raise the risk of sharper swings and less forgiving entry points.
Summary
Game Stop Stock Maintains a Bullish Daily Trend
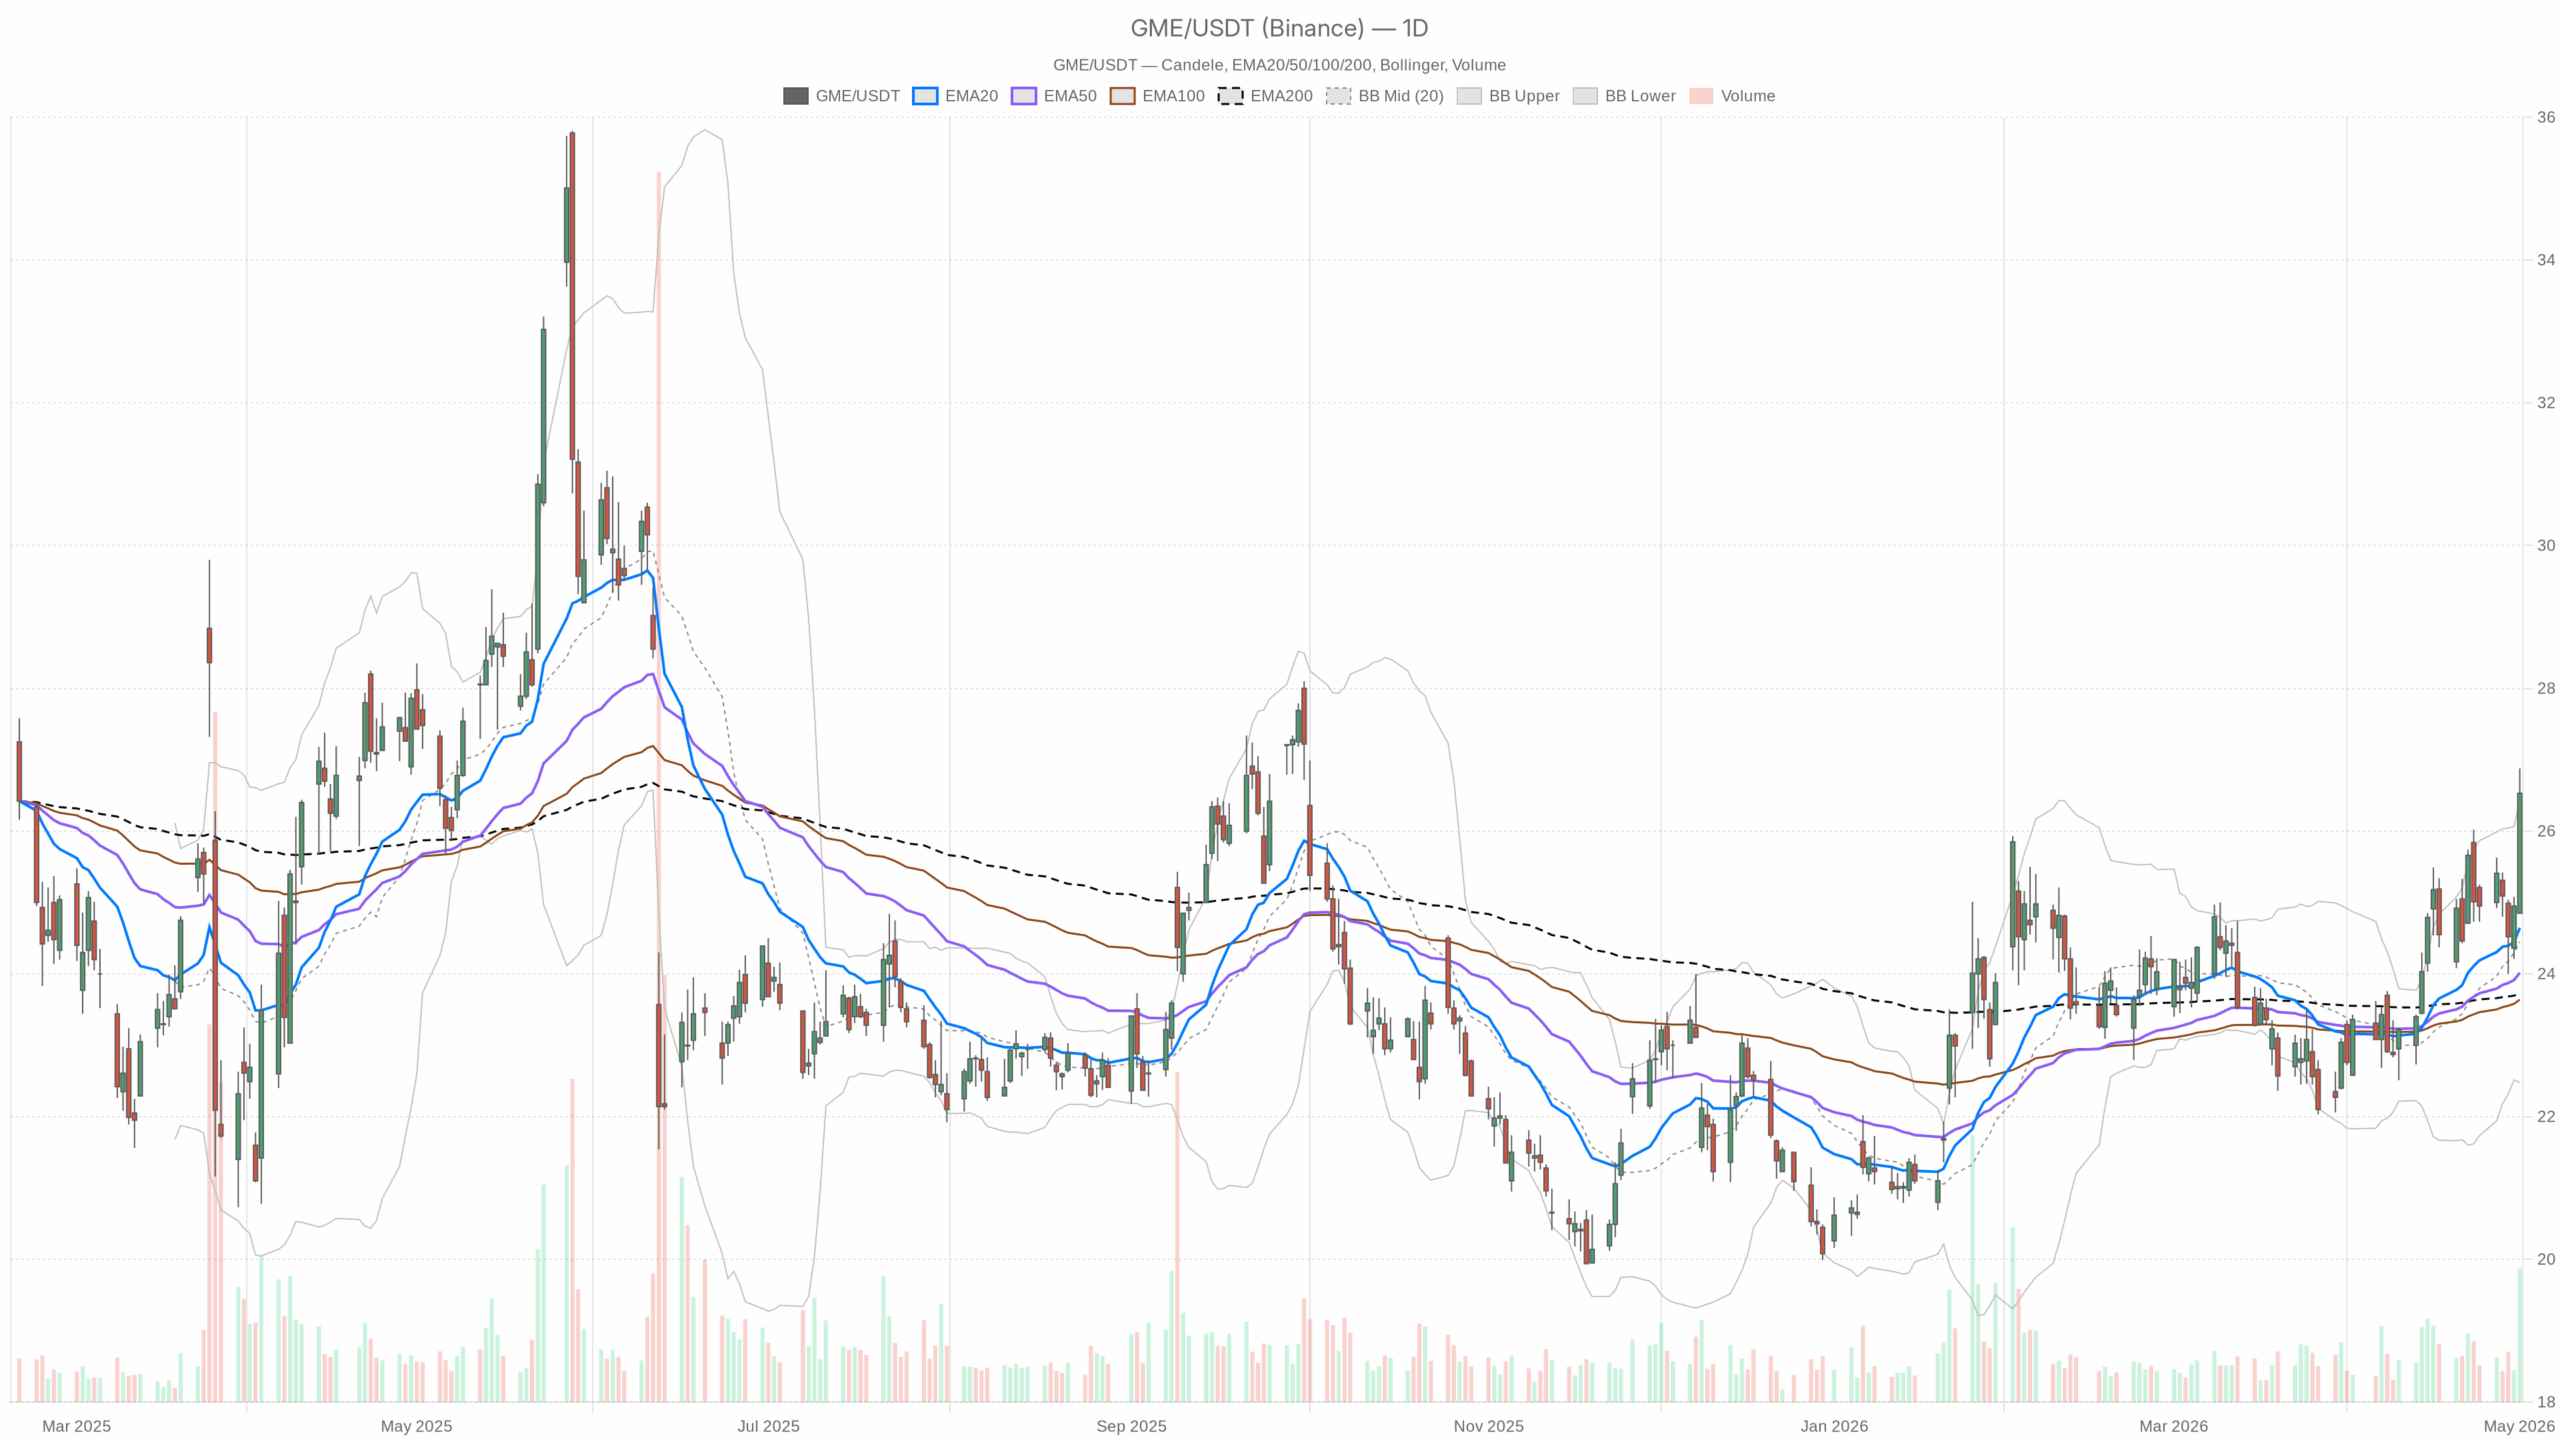
Game Stop Stock closed at 26.53 on May 1. That leaves GME well above its 20-day EMA at 24.64, 50-day EMA at 24.02, and 200-day EMA at 23.72. This alignment reflects strength across short-, medium-, and long-term trend measures. In practical terms, buyers still control the broader structure.
Momentum on the daily chart remains constructive, although it is no longer cheap. RSI stands at 65.2, which points to solid upside momentum without reaching an extreme daily reading. Meanwhile, MACD remains positive, with the line at 0.55 above the 0.43 signal and a positive 0.12 histogram. That setup supports the current push higher and shows momentum is still expanding.
Volatility Signals on the Daily Chart
Price also closed above the daily Bollinger midline at 24.45 and slightly above the upper band at 26.42. That signals strong directional pressure. However, it also shows the stock is pressing the edge of its recent volatility envelope. ATR at 0.99 reinforces that daily movement has expanded, so traders should expect wider swings than in a quieter setup.
Daily pivot structure remains constructive, though it also shows how extended price became into the close. The pivot point sits at 26.09, with resistance at 27.32 and support at 25.29. Holding above the pivot keeps the immediate directional edge positive. Still, the market is already trading closer to resistance than support, which limits room for complacent chasing.
eBay Bid Adds a New Risk Layer for GME
Notably, the latest corporate catalyst adds a fresh layer of volatility risk. News that GameStop has proposed a roughly $56 billion acquisition of eBay changes the near-term trading landscape. Whatever the strategic merits, this kind of headline can amplify both momentum and skepticism. Therefore, the stock may stay technically supported while becoming more sensitive to gap risk and sharp sentiment swings.
Game Stop Stock on the Hourly Chart Looks Strong but Stretched
The hourly chart confirms the bullish daily case, but in a more stretched form. GME closed at 26.52 on the 1H timeframe. That is comfortably above the 20-hour EMA at 25.33, 50-hour EMA at 25.05, and 200-hour EMA at 24.31. As a result, trend continuation remains intact and pullbacks have stayed shallow so far.
At the same time, the hourly momentum profile is overheated. RSI is 75.6, which signals strong upside participation but also warns that the move is crowded in the near term. MACD is still firmly positive, with the line at 0.37 above the 0.13 signal and a 0.23 histogram. That keeps the trend intact, yet it also shows the market is moving quickly rather than building calmly.
Hourly Volatility Context
The hourly Bollinger setup reinforces that point. The upper band is 26.5, and price closed essentially at 26.52, right on that boundary. Usually, that reflects an aggressive upward push. On the other hand, it can also precede consolidation if fresh buying does not follow immediately. Hourly ATR at 0.34 suggests short-term volatility is elevated enough to produce quick reversals near intraday highs.
15-Minute Chart Provides Execution Context
In contrast, the 15-minute chart should be used mainly for execution, not for the main thesis. Price remains above the 20-period EMA at 25.98, the 50-period EMA at 25.41, and the 200-period EMA at 25.05. So, the very short-term tape still favors buyers. RSI at 75.39 is elevated, while MACD stays positive, although the histogram is only 0.07.
That combination implies the short-term trend is still up. However, the rate of momentum expansion is less forceful than on the hourly chart. The 15-minute Bollinger upper band sits at 27.02, leaving some room above the latest 26.52 close. Even so, the intraday pivot at 26.63, with resistance at 26.77 and support at 26.38, shows price is hovering around a tight decision zone.
In other words, this timeframe is useful for timing breakouts or pullbacks. It does not change the broader bullish structure.
Game Stop Stock Bullish and Bearish Scenarios
Bullish Case
The bullish scenario remains the base case as long as GME holds above the daily pivot at 26.09 and, more importantly, above the first daily support near 25.29. A sustained move through 26.77 on the intraday pivots and then toward the daily resistance at 27.32 would keep the breakout narrative alive. If that happens while price stays above the key EMAs and MACD remains positive, buyers would still have a strong technical argument.
Bearish Risk
However, the bearish scenario is not difficult to map out because the stock is extended on both the hourly and 15-minute views. Failure to hold above the 26.09 pivot would be the first sign that momentum is cooling. A deeper move below 25.29 would weaken the daily bullish case and suggest the recent advance is becoming vulnerable to headline-driven profit-taking.
That risk matters even more now because the eBay acquisition news could trigger a more emotional repricing than the chart alone would imply. Overall, Game Stop Stock still trades with a bullish primary bias, and the hourly trend supports that view rather than contradicting it. The complication is not trend direction but short-term stretch. The setup remains constructive, yet volatility and event risk have clearly risen.
