

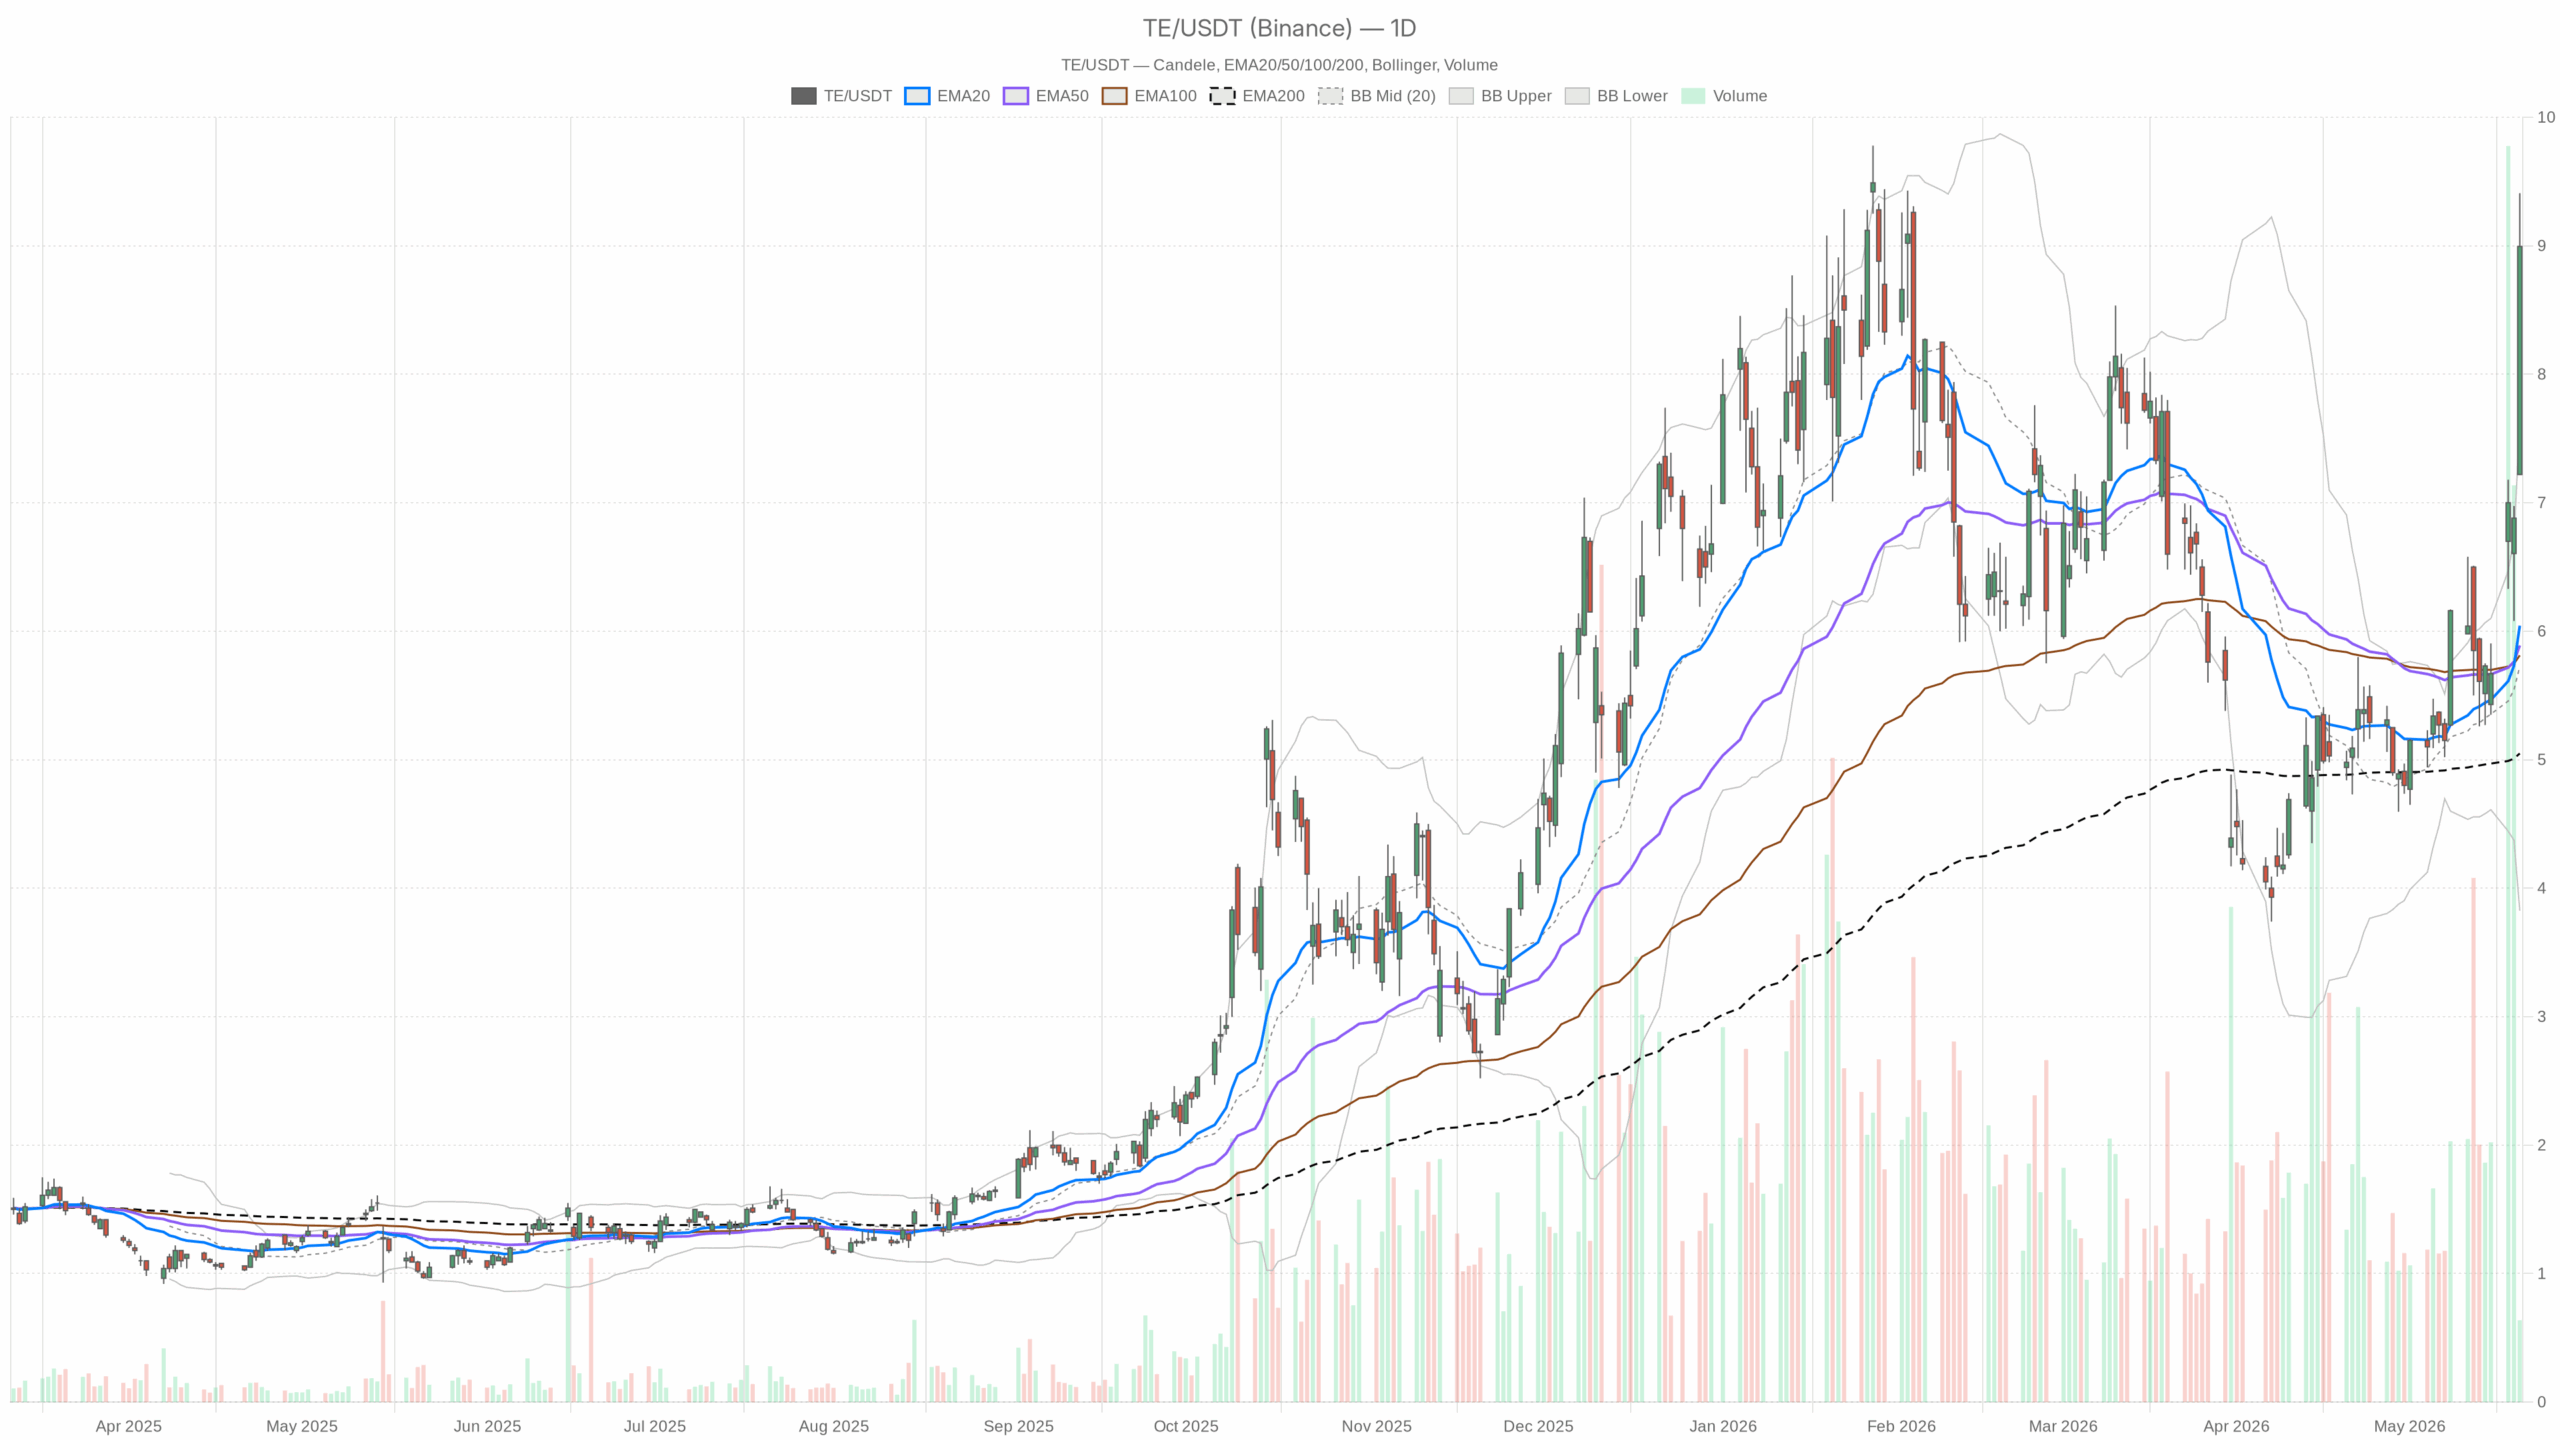
TE stock has exploded higher to 8.99 on the daily close, shifting the primary bias to bullish. However, the rally is now extended and volatility has expanded, which argues for a pause or shallow consolidation before any further advance.
Summary
TE daily outlook: trend control and momentum
On the daily chart, price sits well above the 20/50/200-day EMAs at 6.04/5.89/5.05, signaling strong trend control by buyers. The daily RSI14 is 78.1, which is overbought. That raises pullback risk, though the tape remains firm.
The MACD line at 0.49 vs a 0.16 signal with a +0.33 histogram confirms bullish momentum expansion. Daily Bollinger Bands center/upper/lower are 5.73/7.63/3.82, with price closing at 8.99 above the upper band, showing stretch from the mean. Meanwhile, ATR14 is 0.79, indicating range expansion. The daily pivot grid shows PP at 8.54 with R1 at 9.86 and S1 at 7.67, offering clear levels to manage risk and targets.
Hourly TE stock trend and pivot context
Meanwhile, the 1H timeframe confirms the uptrend but shows a near-term battle around the pivot. Price remains above the 20/50/200-hour EMAs at 7.21/6.46/5.75, preserving a bullish structure. Hourly RSI14 prints 74.96, still hot and prone to intraday dips.
MACD is 0.70 vs 0.44 with a +0.26 histogram, so the positive impulse remains. Hourly Bollinger mid/upper/lower are 6.98/8.94/5.02, with price at 8.99 marginally outside the upper band. Extension is easing but still elevated. ATR14 is 0.51, keeping intraday volatility high. The hourly pivot sits at 9.02 with R1 at 9.17 and S1 at 8.85; the last price is 8.99, just below PP. A quick reclaim above 9.02 would aid continuation.
15-minute execution context for TE stock
At the same time, the 15-minute tape offers execution context. Price is above the 20/50/200-EMA stack at 8.18/7.40/6.34, aligning short-term trend with higher timeframes. The 15m RSI14 is 73.3, strong but vulnerable to fades.
MACD reads 0.60 vs 0.53 with a +0.08 histogram, so momentum is positive but slowing. Bollinger mid/upper are 8.01/9.78, with price at 8.99 back inside the band after an earlier stretch. There is room to chop rather than squeeze. The same intraday pivot map at 9.02/9.17/8.85 frames triggers and support, which is useful for timing entries and risk.
Bullish scenario for TE stock: levels to watch
Therefore, the main scenario remains bullish for TE stock. A firm push and hold back above 9.02 would put 9.17 in play, with the daily R1 at 9.86 as the next objective. If hourly RSI cools while price holds above 8.85 or the daily PP at 8.54, the pullback would likely be constructive. That would signal orderly digestion within an uptrend. This TE technical analysis—anchored in RSI, MACD, EMAs, and Bollinger Bands—still favors the upside.
Risk and invalidation levels
On the other hand, the bullish case weakens if price fails to reclaim 9.02 and slips below 8.85. In contrast, a daily close back under 8.54 would mark a more meaningful shift toward mean reversion, signaling bullish invalidation. A move back inside the daily upper band alongside a fading hourly MACD would add to that risk, pointing toward 7.67 support.
Positioning and volatility in TE stock
Overall, positioning around TE stock should respect the expanded ATR and overbought momentum. Chasing late strength carries slippage risk; meanwhile, consolidation above 8.85/8.54 or a decisive break through 9.17 are cleaner signals. Volatility is high, and timing matters as the market digests a stretched but intact advance.