

Ethereum is currently priced around $1,764, highlighting a significant market development. This is not a simple dip but a prolonged decline pushing Ethereum well below key daily moving averages. The market structure is broken, with selling pressure dominating and no immediate relief visible. The main question remains whether this signals capitulation or another downturn phase.
Summary
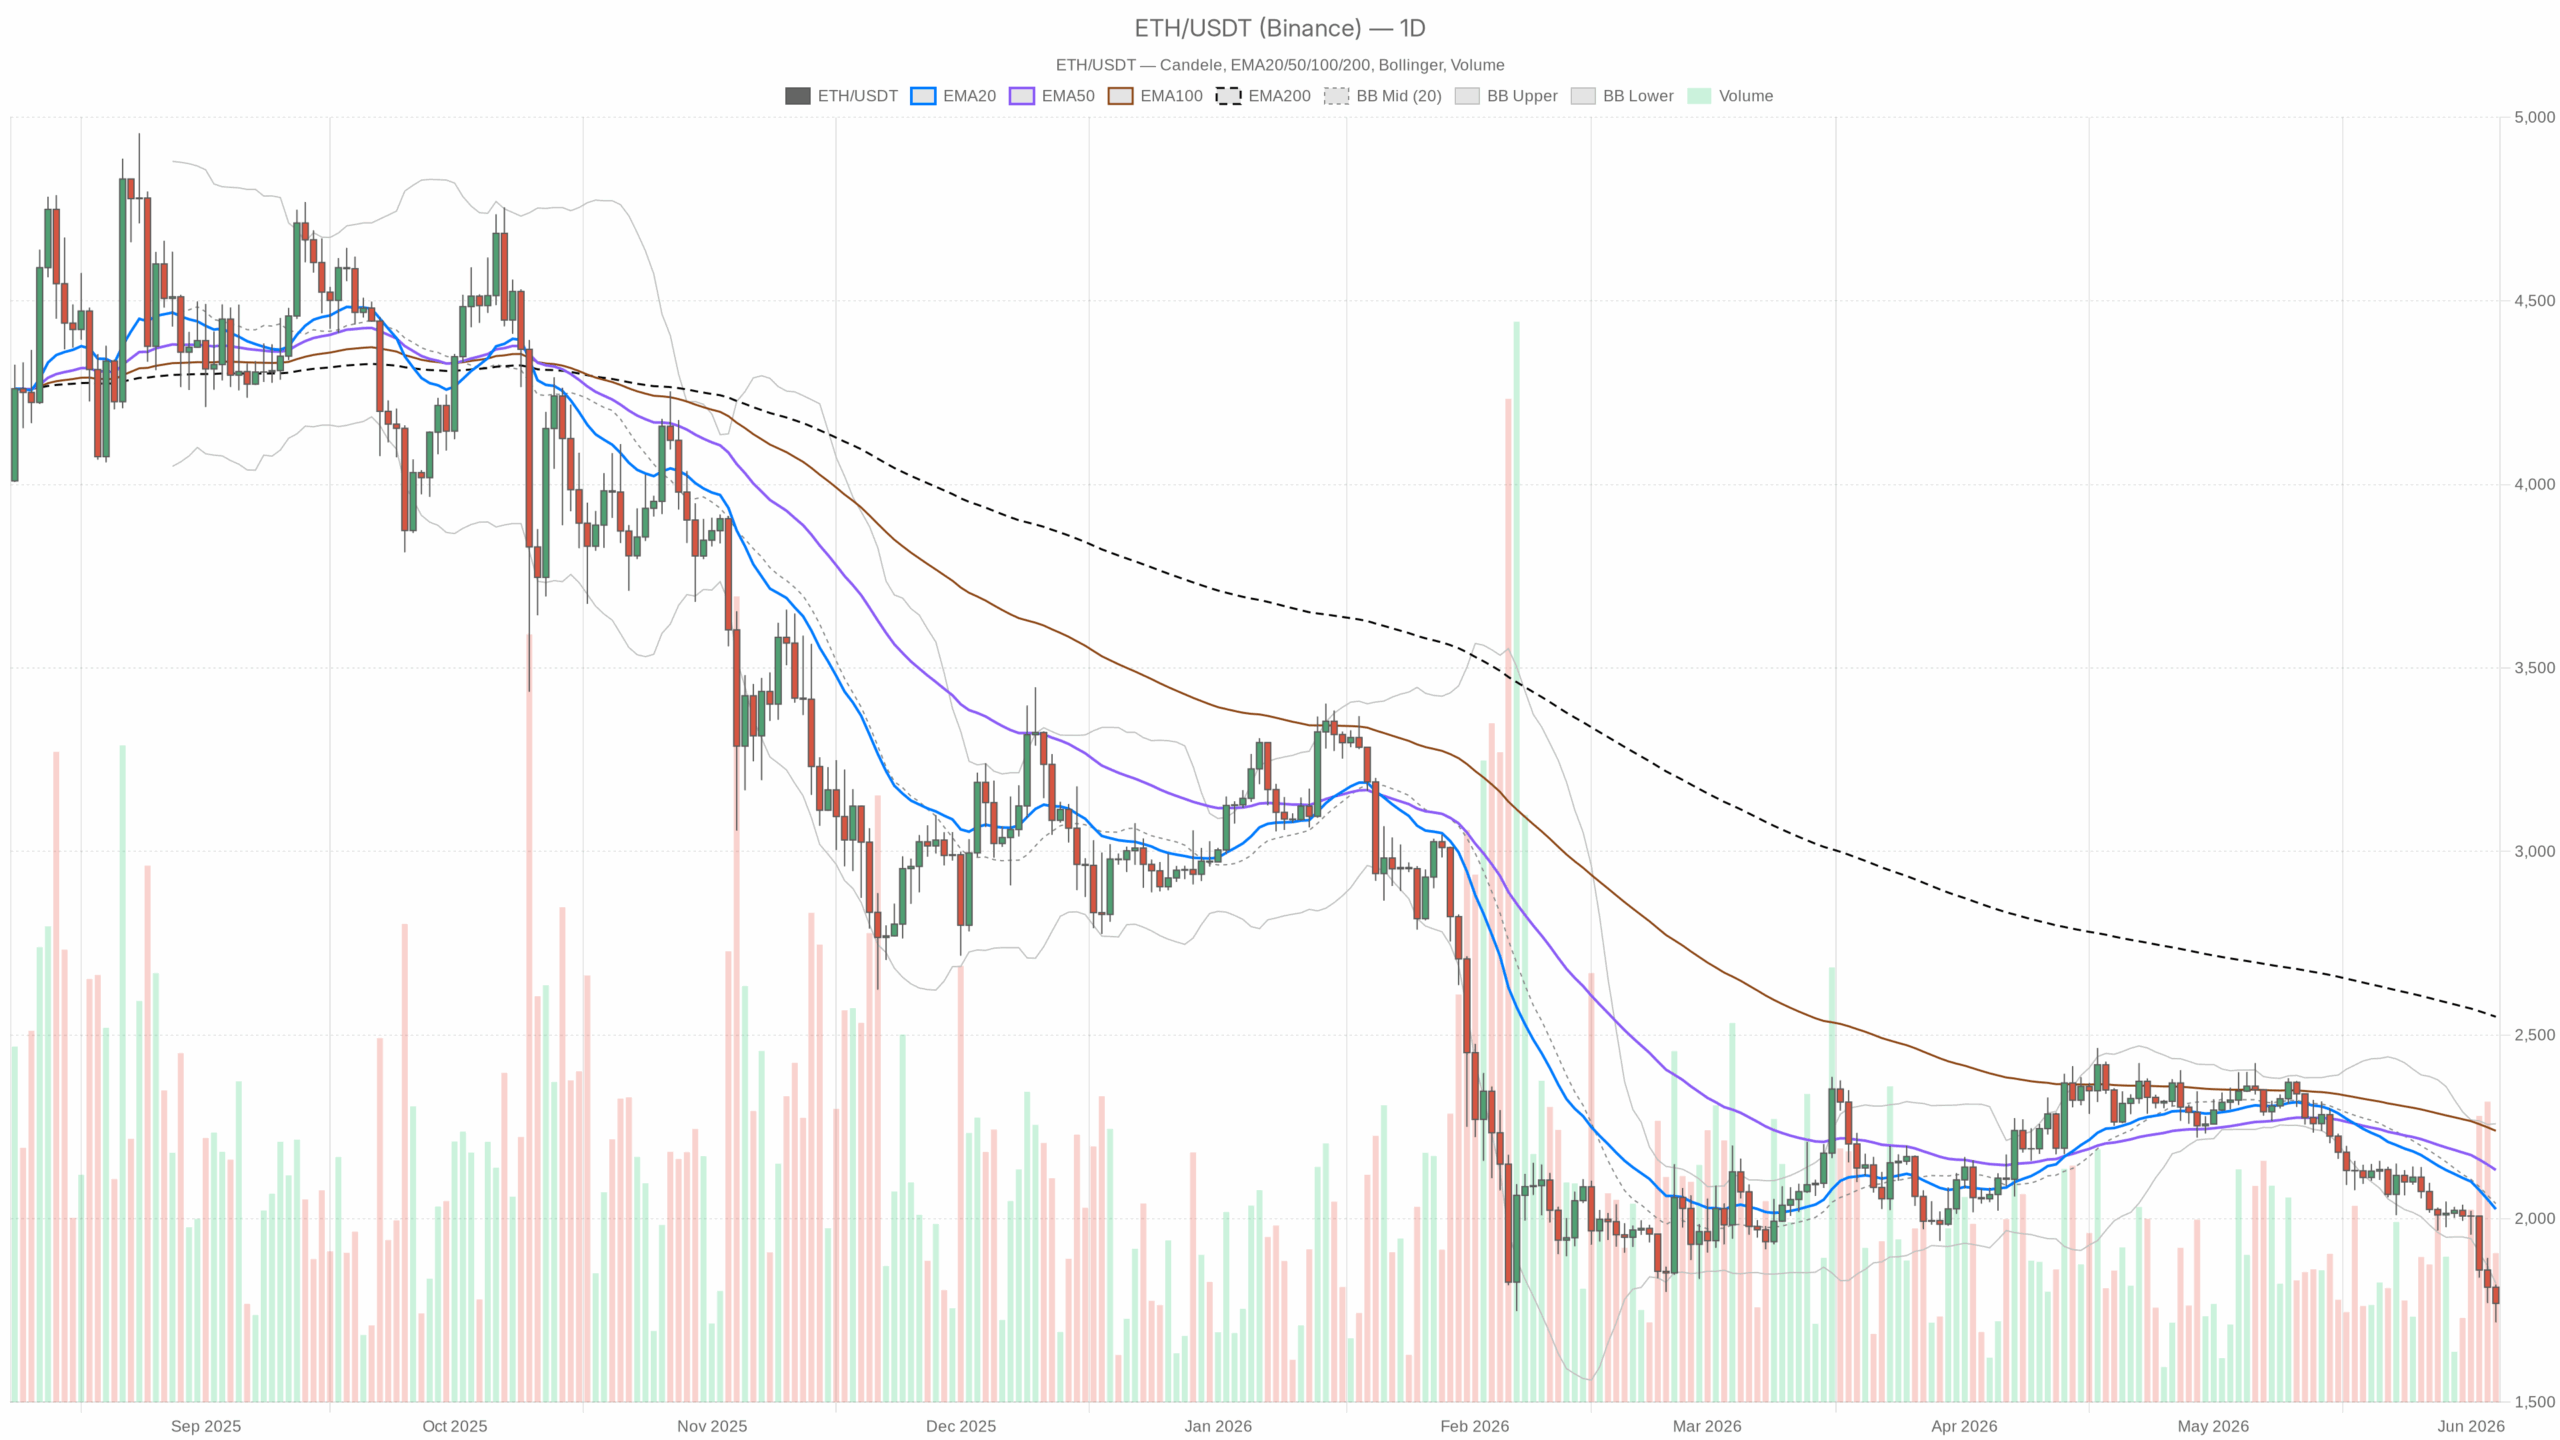
Daily Chart Reveals Strong Bearish Momentum
The daily timeframe clearly indicates bearish conditions. Ethereum’s last close at $1,768.96 falls beneath the EMA20 ($2,025), EMA50 ($2,132), and EMA200 ($2,549), all acting as strong resistance layers. The gap of over $780 from price to the EMA200 underscores the severe deviation from healthy structural levels.
With a daily RSI at 18.25, Ethereum touches one of its most oversold states outside of market crashes, suggesting momentum collapse. Although this low RSI is not a definitive buy signal, it flags extreme selling pressure. The daily MACD is deeply negative, with no sign of momentum easing as the histogram expands downward, indicating persistent bearishness.
Bollinger Bands further confirm this trend, with price breaching the lower band at $1,823 and closing near $1,768. While such a breach might imply short-term selling exhaustion, a sustained walk along the band is typical during strong downtrends. The ATR reading at 84.08 highlights elevated volatility, signaling sharp price movements.
Daily pivot analysis places Ethereum at a critical pivot point of $1,768.91, right at current prices. Resistance stands at $1,820.55 and support at $1,717.33, framing a key inflection zone. A confirmed drop below $1,717 could lead to uncharted bearish territory.
Hourly Chart Shows Stabilization Without Recovery
The hourly chart mirrors the bearish narrative, with Ethereum trading below all EMA levels (20 at $1,808, 50 at $1,858, 200 at $1,961). The $197 distance to the 1H EMA200 reflects strong recent seller dominance. The 1H RSI at 36.39 suggests oversold but not extreme conditions, with MACD histogram near zero indicating a possible momentum slowdown without reversal confirmation.
Price remains near the lower Bollinger Band at $1,746, below the midline at $1,809. Until the midline is reclaimed on hourly closes, there’s no bullish intraday case. The tight pivot range (PP $1,770, R1 $1,777, S1 $1,758) suggests a current holding pattern rather than active trend discovery.
15-Minute Chart Reinforces Bearish Environment
The 15-minute timeframe shows consistent weakness, with price below all EMAs and a $97 gap from the EMA200. RSI at 37.53 and expanding MACD histogram at -2.42 confirm ongoing downward momentum. No recovery signals are structurally sound here, and micro bounces likely falter near $1,768–$1,777 due to supply pressure.
DeFi Activity Indicates On-Chain Engagement
Despite price weakness, decentralized exchange activity suggests ongoing engagement. Uniswap V4 saw a 30.43% daily fee increase and a 91.51% rise over seven days. Curve DEX fees nearly doubled weekly, and Fluid DEX recorded a 49.83% increase over 30 days. This implies capital remains active on-chain, though the nature of the activity—hedging, stablecoin rotation, or genuine DeFi use—is unclear.
Potential Bull Case: Capitulation and Mean Reversion
From a medium-term perspective, the extreme daily RSI near 20 historically precedes strong recoveries. The bull thesis rests on structural oversold conditions paired with “Extreme Fear” sentiment. A rebound toward the Bollinger Band midline at $2,040 (about 15% above current price) represents a minimum mean-reversion target. Surpassing the daily resistance at $1,820 with volume could confirm short-term strength. However, a daily close below $1,717 would negate this optimism, signaling continued selling pressure.
Bear Case: Further Breakdown with No Clear Floor
The bear case is compelling given the lack of MACD compression and open gaps below price before historical demand zones. With Bitcoin dominance rising to 55.6% and total market cap falling sharply, altcoins like Ethereum face a hostile environment. Absent catalysts, Ethereum may decline toward $1,600–$1,650. The bear setup invalidates only if hourly closes sustain above the 1H EMA50 at $1,858 alongside RSI recovery above 50.
Implications for Positioning
Risk asymmetry dominates this environment. The daily RSI at 18.25 suggests short positions risk severe snapbacks. Conversely, buying into a structurally broken trend without confirmation risks substantial losses. Ethereum currently occupies a no-man’s-land: too oversold to short confidently, too broken to buy decisively. Elevated volatility, with daily ATR near 84, implies $80–$100 daily swings are common. Patience, managing position size, and waiting for clearer structural signs are prudent approaches until momentum indicators show signs of normalization.